
Compare Angel Oak Mortgage REIT, Inc. with Similar Stocks
Dashboard
1
Flat results in Jun 25
- PRE-TAX PROFIT(Q) At USD 0.77 MM has Fallen at -92.21%
- NET PROFIT(Q) At USD 0.77 MM has Fallen at -91.57%
- DEBT-EQUITY RATIO (HY) Highest at 811.26 %
2
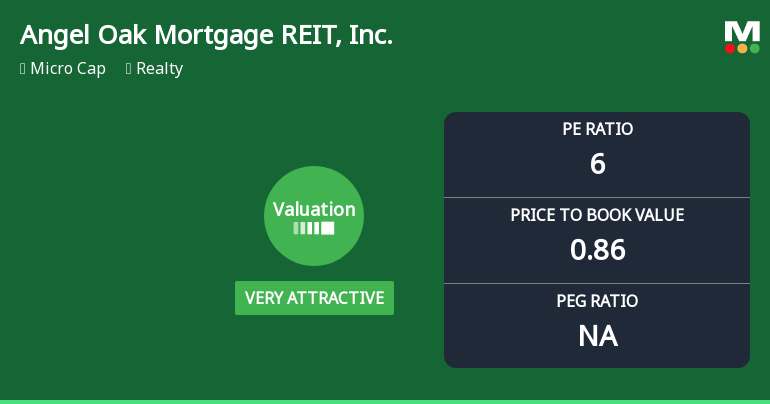
With ROE of 14.48%, it has a very attractive valuation with a 0.86 Price to Book Value
3
Below par performance in long term as well as near term
Total Returns (Price + Dividend) 
TimePeriod
Price Return
Dividend Return
Total Return
3 Months
-8.92%
0%
-8.92%
6 Months
-5.39%
0%
-5.39%
1 Year
-27.02%
0%
-27.02%
2 Years
19.29%
0%
19.29%
3 Years
-33.48%
0%
-33.48%
4 Years
0%
0%
0.0%
5 Years
0%
0%
0.0%
Angel Oak Mortgage REIT, Inc. for the last several years.
Risk Adjusted Returns v/s
News
Angel Oak Mortgage REIT Experiences Revision in Its Stock Evaluation Amid Market Dynamics
Angel Oak Mortgage REIT, Inc. has adjusted its valuation, showcasing a P/E ratio of 6 and a price-to-book value of 0.86. Its strong financial metrics include a return on capital employed of 57.22% and a return on equity of 14.48%, positioning it competitively within the realty sector.
Read full news article Announcements

No announcement available
Corporate Actions
No corporate action available
Quality key factors
Factor
Value
Sales Growth (5y)
6.84%
EBIT Growth (5y)
36.06%
EBIT to Interest (avg)
1.98
Debt to EBITDA (avg)
Negative Net Debt
Net Debt to Equity (avg)
0
Sales to Capital Employed (avg)
0
Tax Ratio
7.55%
Dividend Payout Ratio
109.21%
Pledged Shares
0
Institutional Holding
84.62%
ROCE (avg)
29.18%
ROE (avg)
9.07%
Valuation key factors
Factor
Value
P/E Ratio
6
Industry P/E
Price to Book Value
0.86
EV to EBIT
1.45
EV to EBITDA
1.45
EV to Capital Employed
0.83
EV to Sales
1.61
PEG Ratio
NA
Dividend Yield
NA
ROCE (Latest)
57.22%
ROE (Latest)
14.48%
Technicals key factors
Indicator
Weekly
Monthly
MACD
Mildly Bullish
Mildly Bullish
RSI
No Signal
No Signal
Bollinger Bands
Bearish
Bearish
Moving Averages
Bearish (Daily)
KST
Mildly Bullish
Bearish
Dow Theory
Mildly Bearish
No Trend
OBV
Mildly Bullish
Mildly Bearish
 Technical Indicator Scale: Bearish, Mildly Bearish, Sideways, Mildly Bullish, Bullish Turned
 Shareholding Snapshot : Sep 2025
Shareholding Compare (%holding)
Majority shareholders
Strategic Entities
Domestic Funds
Held in 22 Schemes (13.76%)
Foreign Institutions
Held by 17 Foreign Institutions (12.33%)
Strategic Entities with highest holding
Highest Public shareholder
Quarterly Results Snapshot (Consolidated) - Jun'25 - QoQ
Jun'25
Mar'25
Change(%)
Net Sales
32.60
29.70
9.76%
Operating Profit (PBDIT) excl Other Income
25.90
43.30
-40.18%
Interest
25.20
22.80
10.53%
Exceptional Items
0.00
0.00
Consolidate Net Profit
0.80
20.50
-96.10%
Operating Profit Margin (Excl OI)
795.20%
1,459.00%
-66.38%
USD in Million.

Net Sales
QoQ Growth in quarter ended Jun 2025 is 9.76% vs -20.16% in Mar 2025

Consolidated Net Profit
QoQ Growth in quarter ended Jun 2025 is -96.10% vs 235.76% in Mar 2025
Annual Results Snapshot (Consolidated) - Dec'24
Dec'24
Dec'23
Change(%)
Net Sales
101.20
58.40
73.29%
Operating Profit (PBDIT) excl Other Income
105.50
102.00
3.43%
Interest
73.50
67.10
9.54%
Exceptional Items
0.00
0.00
Consolidate Net Profit
28.80
33.70
-14.54%
Operating Profit Margin (Excl OI)
1,042.60%
1,746.00%
-70.34%
USD in Million.
Net Sales
YoY Growth in year ended Dec 2024 is 73.29% vs -45.32% in Dec 2023
Consolidated Net Profit
YoY Growth in year ended Dec 2024 is -14.54% vs 117.94% in Dec 2023
About Angel Oak Mortgage REIT, Inc.

Angel Oak Mortgage REIT, Inc.
Realty
No Details Available.
Company Coordinates
No Company Details Available
InfinHub Market Technologies FZ-LLC, Building-2, Unit 112, Dubai Internet City, Dubai, United Arab Emirates
GET THE MARKETSMOJO APP


Company
Stocks
Portfolio


"Investment in securities markets are subject to market risk. Read all the related documents carefully before investing."