
Compare Anka India with Similar Stocks
Stock DNA
Diversified consumer products
INR 132 Cr (Micro Cap)
NA (Loss Making)
55
0.00%
0.00
-1.70%
4.88
Total Returns (Price + Dividend) 
Anka India for the last several years.
Risk Adjusted Returns v/s
Returns Beta

News
Anka India Ltd is Rated Strong Sell
Anka India Ltd is rated Strong Sell by MarketsMOJO, with this rating last updated on 23 January 2026. However, the analysis and financial metrics discussed here reflect the stock's current position as of 16 June 2026, providing investors with an up-to-date view of the company’s fundamentals, returns, and market performance.
Read full news article
Anka India Ltd is Rated Strong Sell
Anka India Ltd is rated Strong Sell by MarketsMOJO, with this rating last updated on 23 January 2026. However, the analysis and financial metrics discussed here reflect the stock’s current position as of 01 June 2026, providing investors with the latest insights into the company’s performance and outlook.
Read full news article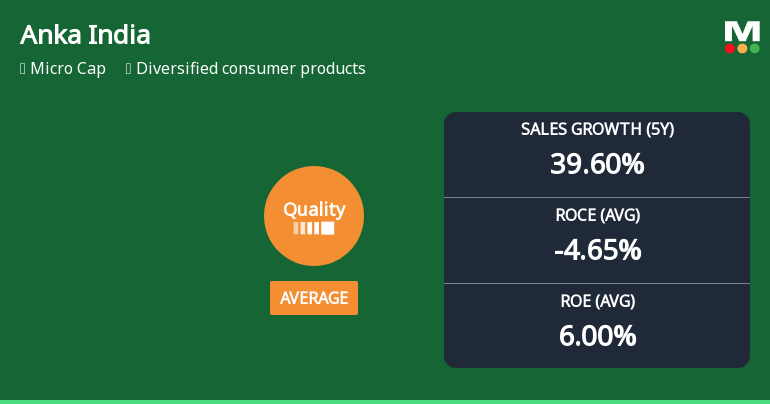
Anka India Ltd Quality Parameters Upgrade: A Mixed Bag for Investors
Anka India Ltd, a micro-cap player in the diversified consumer products sector, has seen its quality grade upgraded from below average to average as of 23 January 2026. Despite this improvement, the company retains a Strong Sell mojo grade of 17.0, reflecting ongoing concerns about its business fundamentals. This article analyses the key financial parameters behind this shift, highlighting areas of progress and persistent challenges for investors.
Read full news article Announcements
This Is With Reference To Our Earlier Intimation Dated May 282026 Regarding The Outcome Of The Board Meeting. The Revised Outcome Of Bard Meeting Dated May 28 2026 Is Being Filed Alongwith The Financial Results Auditors Report And The Statement On Impact
18-Jun-2026 | Source : BSEThis is with reference to our earlier intimation dated May 282026 regarding the outcome of the board meeting dated 28 May2026 alongwith the financial results and Auditors report for Quarter and Financial Year ending March 31 2026. The revised outcome of Board meting dated May 282026 is being filed after reciept of query from BSE Limited for attaching the Statement on Impact of Auidt Qualification which was inadverdently missed in the previous PDF however the same was filed in the Intergrated Financial Reults in XBRL mode on the same date on May 28 2026.alongwith the Financial ResultsAuditors Report and the Statement on Impact of Audit Qualification
Shareholder Meeting / Postal Ballot-Scrutinizers Report
03-Jun-2026 | Source : BSEPlease find enclosed the Scrutinizers Report for the postal ballot closed on June 02 2026 .
Shareholder Meeting / Postal Ballot-Outcome of Postal_Ballot
03-Jun-2026 | Source : BSEOutcome of the Postall Ballot closed on 02.06.2026
Corporate Actions

No Upcoming Board Meetings

No Dividend history available

Anka India Ltd has announced 10:5 stock split, ex-date: 13 Jan 12

No Bonus history available

No Rights history available
Quality key factors
Valuation key factors
Technicals key factors
 Technical Indicator Scale: Bearish, Mildly Bearish, Sideways, Mildly Bullish, Bullish Turned
 Shareholding Snapshot : Mar 2026
Shareholding Compare (%holding)
Promoters
None
Held by 0 Schemes
Held by 0 FIIs
Amit Sharma (59.89%)
None
8.4%
Quarterly Results Snapshot (Standalone) - Mar'26 - QoQ
QoQ Growth in quarter ended Mar 2026 is 0.00% vs 0.00% in Dec 2025

QoQ Growth in quarter ended Mar 2026 is 100.27% vs -14,680.00% in Dec 2025
Half Yearly Results Snapshot (Consolidated) - Sep'25
Growth in half year ended Sep 2025 is 327.51% vs 129.91% in Sep 2024
Growth in half year ended Sep 2025 is 200.00% vs 107.50% in Sep 2024
Nine Monthly Results Snapshot (Consolidated) - Dec'25

YoY Growth in nine months ended Dec 2025 is 103.69% vs 249.31% in Dec 2024
YoY Growth in nine months ended Dec 2025 is 117.14% vs -20.69% in Dec 2024
Annual Results Snapshot (Consolidated) - Mar'26
YoY Growth in year ended Mar 2026 is 39.58% vs 793.79% in Mar 2025
YoY Growth in year ended Mar 2026 is -27.78% vs 53.85% in Mar 2025
About Anka India Ltd

Company Coordinates


