
Compare Anlon Tech with Similar Stocks
Dashboard
High Management Efficiency with a high ROE of 21.87%
Company has a Debt to Equity ratio (avg) of 0.07 times
Healthy long term growth as Net Sales has grown by an annual rate of 49.20% and Operating profit at 78.62%
With ROE of 19.1, it has a Very Expensive valuation with a 6.3 Price to Book Value
Increasing Participation by Institutional Investors
Below par performance in long term as well as near term
Stock DNA
Aerospace & Defense
INR 454 Cr (Micro Cap)
98.00
43
0.00%
0.06
19.09%
6.25
Total Returns (Price + Dividend) 
Anlon Tech for the last several years.
Risk Adjusted Returns v/s
Returns Beta

News
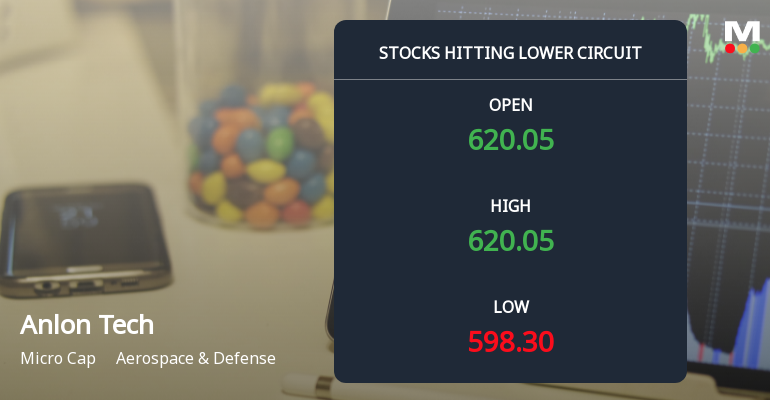
Anlon Technology Solutions Ltd Locks at Lower Circuit With 4.99% Loss — Sellers Queue, No Buyers in Sight
At Rs 598.30, sellers were still queuing — but there were no buyers willing to take the other side. Anlon Technology Solutions Ltd locked at its lower circuit of 4.99% on 27 Jul 2026, with unfilled sell orders and a frozen price, reflecting persistent selling pressure in a micro-cap stock.
Read full news article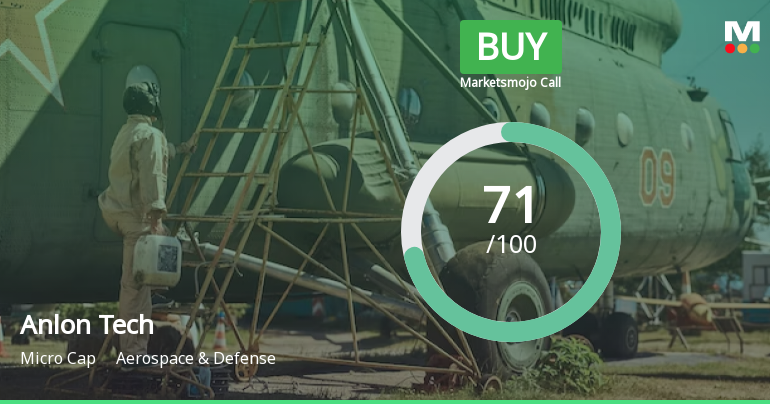
Anlon Technology Solutions Ltd is Rated Buy
Anlon Technology Solutions Ltd is rated Buy by MarketsMOJO, with this rating last updated on 20 July 2026. While the rating change occurred on that date, the analysis and financial metrics discussed here reflect the company’s current position as of 24 July 2026, providing investors with the most up-to-date insight into the stock’s performance and outlook.
Read full news article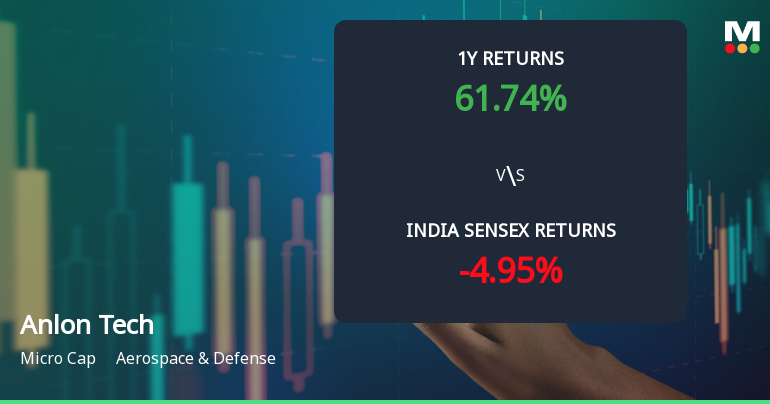
Anlon Technology Solutions Ltd Sees Bullish Momentum Shift Amid Mixed Technical Signals
Anlon Technology Solutions Ltd, a micro-cap player in the Aerospace & Defense sector, has witnessed a notable shift in its technical momentum, upgrading its MarketsMOJO grade from Hold to Buy as of 20 Jul 2026. This upgrade reflects a strengthening bullish trend supported by key technical indicators, signalling renewed investor interest and potential upside in the stock’s price trajectory.
Read full news article Announcements
Corporate Actions

No Upcoming Board Meetings

No Dividend history available

No Splits history available

No Bonus history available

No Rights history available
Quality key factors
Valuation key factors
Technicals key factors
 Technical Indicator Scale: Bearish, Mildly Bearish, Sideways, Mildly Bullish, Bullish Turned
 Shareholding Snapshot : Jun 2026
Shareholding Compare (%holding)
Promoters
None
Held by 1 Schemes (4.99%)
Held by 1 FIIs (0.97%)
Unnikrishnan Nair Pm (25.81%)
Bandhan Small Cap Fund (4.99%)
25.58%
Quarterly Results Snapshot (Standalone) - Mar'23 - QoQ

QoQ Growth in quarter ended Mar 2023 is 18.65% vs 8.82% in Dec 2022
QoQ Growth in quarter ended Mar 2023 is 938.89% vs -86.86% in Dec 2022
Half Yearly Results Snapshot (Standalone) - Sep'25

Growth in half year ended Sep 2025 is 32.76% vs 63.54% in Mar 2025
Growth in half year ended Sep 2025 is 37.56% vs 54.51% in Mar 2025
Nine Monthly Results Snapshot (Standalone) - Mar'23
YoY Growth in nine months ended Mar 2023 is 75.03% vs 5.20% in Mar 2023
YoY Growth in nine months ended Mar 2023 is 64.93% vs 8.07% in Mar 2023
Annual Results Snapshot (Standalone) - Mar'25
YoY Growth in year ended Mar 2025 is 43.43% vs 6.48% in Mar 2024
YoY Growth in year ended Mar 2025 is 43.58% vs 1.80% in Mar 2024
About Anlon Technology Solutions Ltd

Company Coordinates


