
Compare Anmol India with Similar Stocks
Total Returns (Price + Dividend) 
Anmol India for the last several years.
Risk Adjusted Returns v/s
Returns Beta

News

Anmol India Ltd is Rated Sell by MarketsMOJO
Anmol India Ltd is rated Sell by MarketsMOJO, with this rating last updated on 15 June 2026. However, the analysis and financial metrics discussed here reflect the stock’s current position as of 17 June 2026, providing investors with the latest insights into the company’s performance and outlook.
Read full news article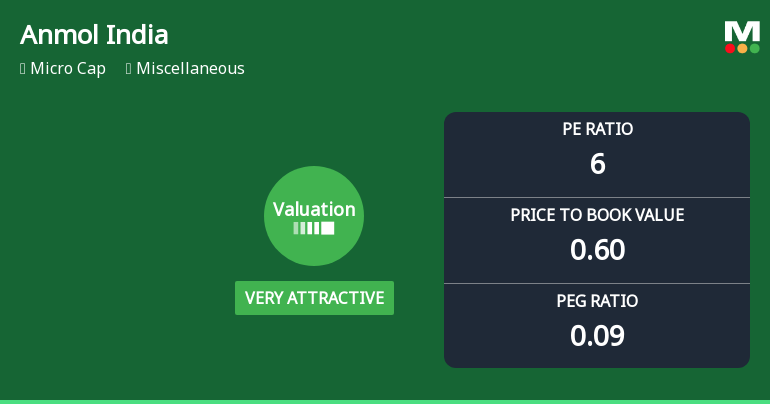
Anmol India Ltd Valuation Shifts Signal Renewed Price Attractiveness Amid Market Challenges
Anmol India Ltd has witnessed a significant shift in its valuation parameters, moving from an attractive to a very attractive rating, despite ongoing challenges reflected in its micro-cap status and subdued returns relative to the broader market. This development invites a closer examination of the company’s price-to-earnings (P/E) and price-to-book value (P/BV) ratios in comparison to historical levels and peer averages, providing investors with a nuanced perspective on its current price attractiveness.
Read full news article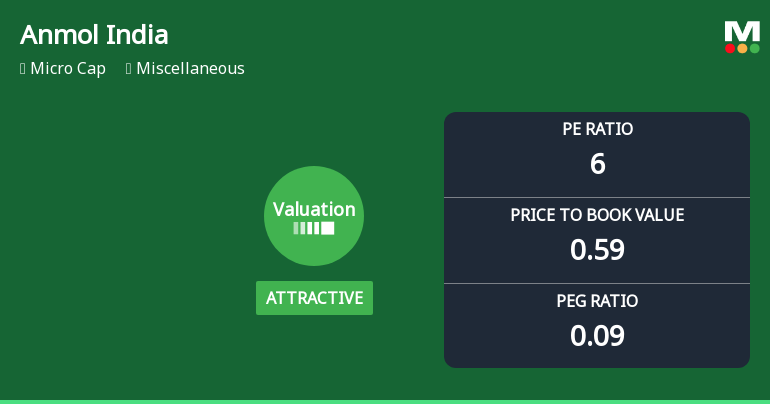
Anmol India Ltd Valuation Shifts Signal Changing Market Sentiment
Anmol India Ltd has witnessed a notable shift in its valuation parameters, moving from a very attractive to an attractive price level, despite ongoing market headwinds and a challenging performance relative to the broader Sensex. This article analyses the recent changes in key valuation metrics such as the price-to-earnings (P/E) ratio and price-to-book value (P/BV), comparing them with historical averages and peer benchmarks to assess the stock’s current price attractiveness and investment potential.
Read full news article Announcements
Corporate Actions

No Upcoming Board Meetings

No Dividend history available

No Splits history available

Anmol India Ltd has announced 4:1 bonus issue, ex-date: 18 Jul 23

No Rights history available
Quality key factors
Valuation key factors
Technicals key factors
 Technical Indicator Scale: Bearish, Mildly Bearish, Sideways, Mildly Bullish, Bullish Turned
 Shareholding Snapshot : Mar 2026
Shareholding Compare (%holding)
Promoters
38.2763
Held by 0 Schemes
Held by 0 FIIs
Chakshu Goyal (18.76%)
Kapil (6.88%)
39.71%
Quarterly Results Snapshot (Standalone) - Mar'26 - QoQ

QoQ Growth in quarter ended Mar 2026 is 1.76% vs 32.80% in Dec 2025
QoQ Growth in quarter ended Mar 2026 is -14.63% vs 4,100.00% in Dec 2025
Half Yearly Results Snapshot (Standalone) - Sep'25

Growth in half year ended Sep 2025 is 14.00% vs 1.78% in Sep 2024
Growth in half year ended Sep 2025 is 16.77% vs -60.02% in Sep 2024
Nine Monthly Results Snapshot (Standalone) - Dec'25
YoY Growth in nine months ended Dec 2025 is 15.50% vs -12.59% in Dec 2024
YoY Growth in nine months ended Dec 2025 is 63.08% vs -68.26% in Dec 2024
Annual Results Snapshot (Standalone) - Mar'26
YoY Growth in year ended Mar 2026 is 11.17% vs -15.12% in Mar 2025
YoY Growth in year ended Mar 2026 is 61.66% vs -66.56% in Mar 2025
About Anmol India Ltd

Company Coordinates


