
 Price Point
Compare Anmol India with Similar Stocks
ScoreDashboard
High Debt company with Weak Long Term Fundamental Strength
- Poor long term growth as Net Sales has grown by an annual rate of 12.58% and Operating profit at 5.29% over the last 5 years
- High Debt Company with a Debt to Equity ratio (avg) of 4.93 times
Positive results in Jun 26
With ROCE of 8.1, it has a Very Attractive valuation with a 0.8 Enterprise value to Capital Employed
38.28% of Promoter Shares are Pledged
Consistent Underperformance against the benchmark over the last 3 years


 Total Returns
Total Returns (Price + Dividend) 
Anmol India for the last several years.
Risk Adjusted Returns v/s
Returns Beta
 News & Corporate Actions
News
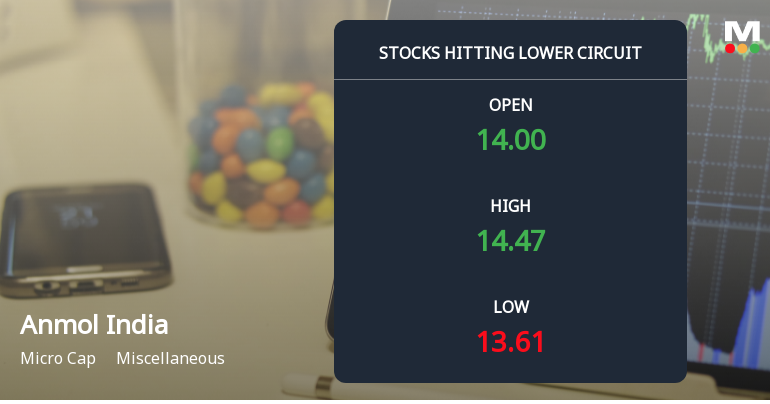
Below All Moving Averages and Now at Lower Circuit: Anmol India Ltd Loses 3.78% in a Single Session
At Rs 13.5, sellers were still queuing — but there were no buyers willing to take the other side. Anmol India Ltd locked at its lower circuit of 5% on 23 Sep 2026, with unfilled sell orders and a frozen price.
Read full news article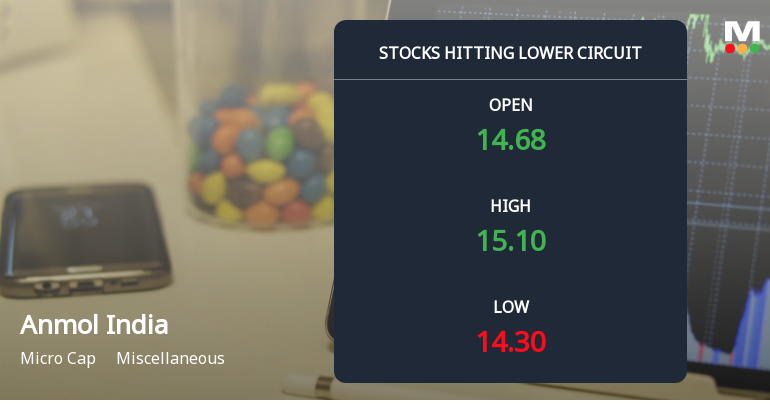
Anmol India Ltd Locks at Lower Circuit With 5% Loss — Sellers Queue, No Buyers in Sight
At Rs 13.98, sellers were still queuing — but there were no buyers willing to take the other side. Anmol India Ltd locked at its lower circuit of 5% on 22 Sep 2026, with unfilled sell orders and a frozen price, signalling a pronounced imbalance between supply and demand.
Read full news article
Anmol India Ltd Upgraded to Hold on Improved Technicals and Valuation
Anmol India Ltd has seen its investment rating upgraded from Sell to Hold, reflecting improvements in valuation metrics and technical indicators despite ongoing challenges in financial trends and quality parameters. The micro-cap company’s Mojo Score has risen to 53.0, signalling a more balanced outlook amid mixed performance against benchmarks and sector peers.
Read full news article Announcements
Closure of Trading Window
22-Sep-2026 | Source : BSEIt is hereby informed that the Trading Window for dealing in the securities of the Company will remain closed for all Designated Persons and Persons having access to Unpublished Price Sensitive Information with effect from 01st October 2026 till the expiry of 48 hours after the declaration of Financial Results for the Quarter and HY ended 30th September 2026.
Clarification sought from" Anmol India Ltd
10-Sep-2026 | Source : BSEThe Exchange has sought clarification from Anmol India Ltd on September 10 2026 with reference to significant movement in price in order to ensure that investors have latest relevant information about the company and to inform the market so that the interest of the investors is safeguarded.
The reply is awaited.
Clarification On Movement In Price
10-Sep-2026 | Source : BSEThis is with reference to the clarification sought by the Stock Exchange regarding the movement in the price of the Companys Securities. The movement in the share price is purely market driven.
Corporate Actions

No Upcoming Board Meetings

No Dividend history available

No Splits history available

Anmol India Ltd has announced 4:1 bonus issue, ex-date: 18 Jul 23

No Rights history available
Key FactorsQuality key factors
Valuation key factors
Technicals key factors
 Technical Indicator Scale: Bearish, Mildly Bearish, Sideways, Mildly Bullish, Bullish Turned Shareholding
Shareholding Snapshot : Jun 2026
Shareholding Compare (%holding)
Promoters
38.2763
Held by 0 Schemes
Held by 0 FIIs
Chakshu Goyal (18.76%)
Kapil (6.88%)
39.76%
FinancialQuarterly Results Snapshot (Standalone) - Jun'26 - QoQ
 Compare with Peers
QoQ Growth in quarter ended Jun 2026 is 47.72% vs 1.76% in Mar 2026
QoQ Growth in quarter ended Jun 2026 is 139.04% vs -14.63% in Mar 2026

Half Yearly Results Snapshot (Standalone) - Sep'25
Growth in half year ended Sep 2025 is 14.00% vs 1.78% in Sep 2024
Growth in half year ended Sep 2025 is 16.77% vs -60.02% in Sep 2024
Nine Monthly Results Snapshot (Standalone) - Dec'25
YoY Growth in nine months ended Dec 2025 is 15.50% vs -12.59% in Dec 2024
YoY Growth in nine months ended Dec 2025 is 63.08% vs -68.26% in Dec 2024
Annual Results Snapshot (Standalone) - Mar'26
YoY Growth in year ended Mar 2026 is 11.17% vs -15.12% in Mar 2025
YoY Growth in year ended Mar 2026 is 61.66% vs -66.56% in Mar 2025
 Company CV
About Anmol India Ltd

Company Coordinates








