
Compare Ansal Buildwell with Similar Stocks
Total Returns (Price + Dividend) 
Latest dividend: 1 per share ex-dividend date: Sep-19-2025
Risk Adjusted Returns v/s
Returns Beta

News
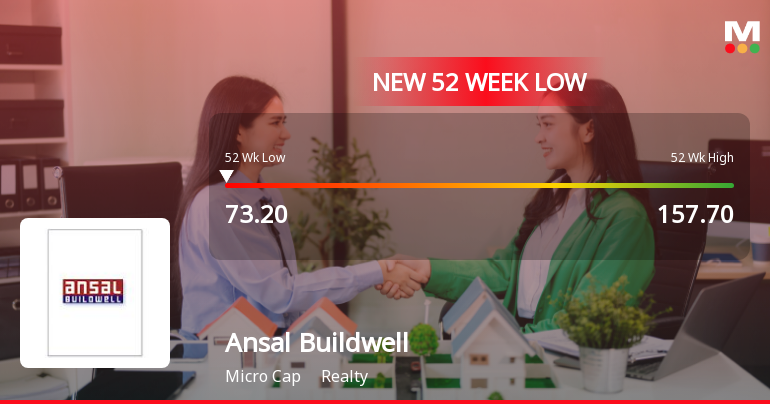
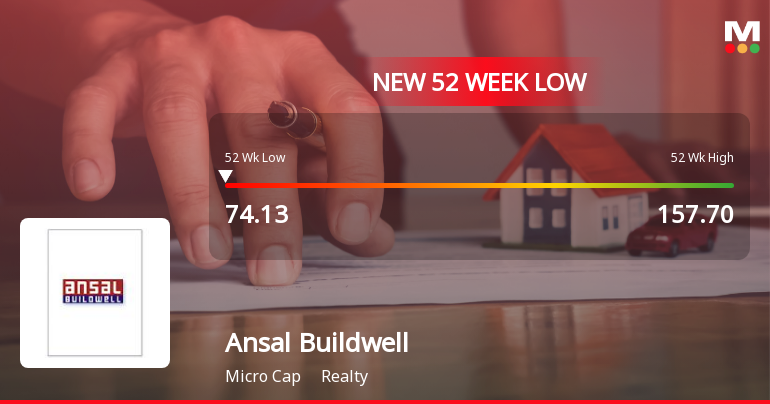

Ansal Buildwell Ltd is Rated Strong Sell
Ansal Buildwell Ltd is rated Strong Sell by MarketsMOJO, with this rating last updated on 16 February 2026. However, the analysis and financial metrics discussed here reflect the company’s current position as of 22 July 2026, providing investors with the latest insights into the stock’s performance and outlook.
Read full news article Announcements
Disclosure Under Regulation 30 Of SEBI(LODR) Regulation 2015 Regarding The Order Approved By NCLT New Delhi Ref. : M/S. Ansal Crown Infrabuild Pvt. Ltd. A Subsidiary Of M/S. Ansal Buildwell Ltd.
17-Jul-2026 | Source : BSECopy of the order of Honble National Company Law Tribunal New Delhi Bench Court-IV in respect of M/s. Ansal Crown Infrabuild Pvt. Ltd. our subsidiary Company vide which Resolution Plan by M/s. Nanu Ram Goyal & Co.(Successful Resolution applicant/SRA) was approved.
Board Meeting Intimation for Notice Of The Board Meeting
16-Jul-2026 | Source : BSEAnsal Buildwell Ltd-has informed BSE that the meeting of the Board of Directors of the Company is scheduled on 12/08/2026 inter alia to consider and approve Meeting of Board of Directors of the Company will be held on Wednesday the 12th August 2026 at the Registered Office of the Company to consider adn approve the Standalone and Consolidated Unaudited Financial Results of the Company for the quarter and three months ended 30th June. 2026.
Compliances-Certificate under Reg. 74 (5) of SEBI (DP) Regulations 2018
13-Jul-2026 | Source : BSEConfirmation certificate in the matter of Regulation 74(5) of Secrutities and Exchange Board of India(Depositories and Participants) Regulations 2018 for the quarter ended 30th June 2026.
Corporate Actions

12 Aug 2026

Ansal Buildwell Ltd has declared 10% dividend, ex-date: 19 Sep 25

No Splits history available

No Bonus history available

No Rights history available
Quality key factors
Valuation key factors
Technicals key factors
 Technical Indicator Scale: Bearish, Mildly Bearish, Sideways, Mildly Bullish, Bullish Turned
 Shareholding Snapshot : Jun 2026
Shareholding Compare (%holding)
Promoters
None
Held by 2 Schemes (0.02%)
Held by 0 FIIs
A P M Buildcon Pvt Ltd (13.32%)
Aparna Jain (3.34%)
32.64%
Quarterly Results Snapshot (Consolidated) - Mar'26 - QoQ

QoQ Growth in quarter ended Mar 2026 is 685.63% vs -89.46% in Dec 2025
QoQ Growth in quarter ended Mar 2026 is 58.29% vs -177.85% in Dec 2025
Half Yearly Results Snapshot (Consolidated) - Sep'25

Growth in half year ended Sep 2025 is 2.27% vs 75.24% in Sep 2024
Growth in half year ended Sep 2025 is 90.38% vs -7.42% in Sep 2024
Nine Monthly Results Snapshot (Consolidated) - Dec'25
YoY Growth in nine months ended Dec 2025 is -18.89% vs -12.75% in Dec 2024
YoY Growth in nine months ended Dec 2025 is -32.56% vs -82.32% in Dec 2024
Annual Results Snapshot (Consolidated) - Mar'26
YoY Growth in year ended Mar 2026 is -17.33% vs 18.15% in Mar 2025
YoY Growth in year ended Mar 2026 is -89.82% vs -45.14% in Mar 2025
About Ansal Buildwell Ltd

Company Coordinates


