
Compare Ansal Properties with Similar Stocks
Dashboard
With a Negative Book Value, the company has a Weak Long Term Fundamental Strength
- Low ability to service debt as the company has a high Debt to EBITDA ratio of -0.12 times
- The company has been able to generate a Return on Equity (avg) of 0.48% signifying low profitability per unit of shareholders funds
Risky - Negative EBITDA
72.38% of Promoter Shares are Pledged
Consistent Underperformance against the benchmark over the last 3 years
Total Returns (Price + Dividend) 
Latest dividend: 0.5 per share ex-dividend date: Sep-15-2011
Risk Adjusted Returns v/s
Returns Beta

News
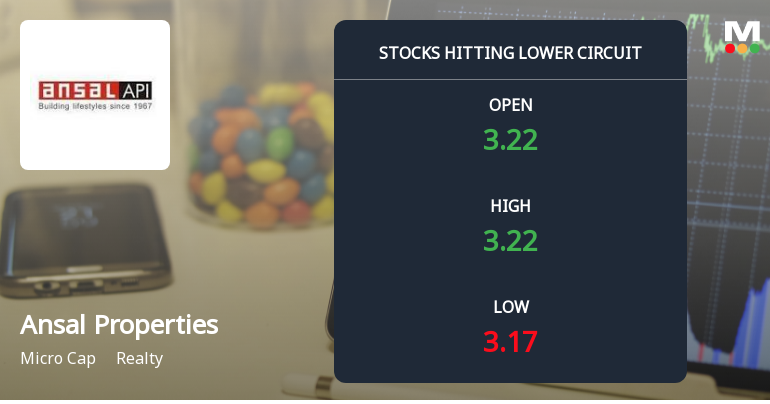
Below All Moving Averages and Now at Lower Circuit: Ansal Properties & Infrastructure Ltd Loses 1.86% in a Single Session
At Rs 3.17, sellers were still queuing — but there were no buyers willing to take the other side. Ansal Properties & Infrastructure Ltd locked at its lower circuit of 2% on 19 Jun 2026, with unfilled sell orders and a frozen price, signalling persistent selling pressure in a micro-cap stock with limited liquidity.
Read full news article
Below All Moving Averages and Now at Lower Circuit: Ansal Properties & Infrastructure Ltd Loses 1.82% in a Single Session
At Rs 3.23, sellers were still queuing — but there were no buyers willing to take the other side. Ansal Properties & Infrastructure Ltd locked at its lower circuit of 2% on 18 Jun 2026, with unfilled sell orders and a frozen price, signalling persistent selling pressure in a micro-cap stock with limited liquidity.
Read full news article
Ansal Properties & Infrastructure Ltd is Rated Sell
Ansal Properties & Infrastructure Ltd is rated 'Sell' by MarketsMOJO, with this rating last updated on 08 June 2026. However, the analysis and financial metrics discussed here reflect the stock's current position as of 17 June 2026, providing investors with the most recent insights into the company’s performance and outlook.
Read full news article Announcements
Announcement under Regulation 30 (LODR)-Newspaper Publication
18-Jun-2026 | Source : BSEThe Company has informed the stock exchanges about the copy of newspaper advertisement published on 18th June 2026 in Financial Express (English) and Jansatta (Hindi) in compliance with SEBI Circular dated the 30th January 2026.
02Nd Quarter / Half Year Ended On The 30Th September 2025 Of The Financial Year 2025-26.
18-Jun-2026 | Source : BSEThe Company has submitted the Un-Audited financial Results for the 02nd Quarter/ half year ended the 30th September 2025.
Un-Audited Financial Results (Standalone) For The 03Rd Quarter Ended On The 31St December 2025 Of The Financial Year 2025-26
18-Jun-2026 | Source : BSEThe Company has submitted the Un-audited Financial Results for the 03rd Quarter ended 31st December 2025.
Corporate Actions

No Upcoming Board Meetings

Ansal Properties & Infrastructure Ltd has declared 10% dividend, ex-date: 15 Sep 11

Ansal Properties & Infrastructure Ltd has announced 5:10 stock split, ex-date: 10 May 06

Ansal Properties & Infrastructure Ltd has announced 1:1 bonus issue, ex-date: 23 Apr 07

No Rights history available
Quality key factors
Valuation key factors
Technicals key factors
 Technical Indicator Scale: Bearish, Mildly Bearish, Sideways, Mildly Bullish, Bullish Turned
 Shareholding Snapshot : Mar 2026
Shareholding Compare (%holding)
Non Institution
72.3797
Held by 2 Schemes (0.0%)
Held by 4 FIIs (0.25%)
Sushil Ansal (16.87%)
Ashok Kumar Gupta (1.97%)
37.94%
Quarterly Results Snapshot (Standalone) - Dec'25 - QoQ

QoQ Growth in quarter ended Dec 2025 is 134.22% vs -43.93% in Sep 2025
QoQ Growth in quarter ended Dec 2025 is 4,887.30% vs -104.77% in Sep 2025
Half Yearly Results Snapshot (Standalone) - Sep'25

Growth in half year ended Sep 2025 is -92.85% vs 31.10% in Sep 2024
Growth in half year ended Sep 2025 is 106.04% vs -2,223.19% in Sep 2024
Nine Monthly Results Snapshot (Standalone) - Dec'25
YoY Growth in nine months ended Dec 2025 is -92.52% vs 53.85% in Dec 2024
YoY Growth in nine months ended Dec 2025 is 121.88% vs -1,097.55% in Dec 2024
Annual Results Snapshot (Standalone) - Mar'25
YoY Growth in year ended Mar 2025 is 34.97% vs -24.37% in Mar 2024
YoY Growth in year ended Mar 2025 is -33,216.46% vs 101.29% in Mar 2024
About Ansal Properties & Infrastructure Ltd

Company Coordinates


