
Compare Anthem Bioscienc with Similar Stocks
Dashboard
Strong Long Term Fundamental Strength with an average Return on Equity (ROE) of 19.93%
- Healthy long term growth as Operating profit has grown by an annual rate 44.32%
- The company is Net-Debt Free
The company declared positive results in Mar'26 after negative results in Dec'25
Increasing Participation by Institutional Investors
Company is among the highest 1% of companies rated by MarketsMojo across all 4,000 stocks
Stock DNA
Pharmaceuticals & Biotechnology
INR 43,451 Cr (Mid Cap)
72.00
34
0.00%
-0.28
21.62%
13.55
Total Returns (Price + Dividend) 
Anthem Bioscienc for the last several years.
Risk Adjusted Returns v/s
Returns Beta

News

Anthem Biosciences Ltd is Rated Buy by MarketsMOJO
Anthem Biosciences Ltd is rated 'Buy' by MarketsMOJO, with this rating last updated on 21 May 2026. However, the analysis and financial metrics discussed here reflect the stock's current position as of 13 June 2026, providing investors with an up-to-date perspective on the company’s fundamentals, valuation, financial trends, and technical outlook.
Read full news article
Anthem Biosciences Ltd is Rated Buy
Anthem Biosciences Ltd is rated Buy by MarketsMOJO, with this rating last updated on 21 May 2026. However, the analysis and financial metrics presented here reflect the company’s current position as of 02 June 2026, providing investors with the latest insights into its fundamentals, returns, and overall market stance.
Read full news article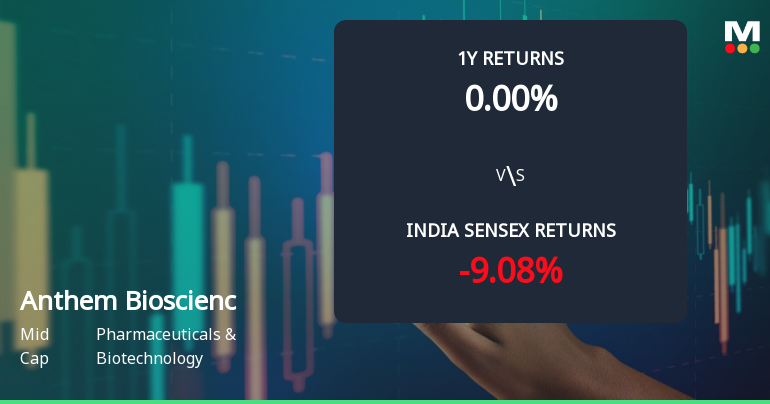
Anthem Biosciences Ltd Technical Momentum Shifts Signal Bullish Outlook
Anthem Biosciences Ltd has witnessed a notable shift in its technical momentum, with key indicators signalling a transition from a mildly bullish to a bullish trend. This change, coupled with an upgrade in its Mojo Grade from Sell to Buy, reflects improving market sentiment and potential upside for investors in the Pharmaceuticals & Biotechnology sector.
Read full news article Announcements
Disclosures under Reg. 29(2) of SEBI (SAST) Regulations 2011
19-Jun-2026 | Source : BSEThe Exchange has received the disclosure under Regulation 29(2) of SEBI (Substantial Acquisition of Shares & Takeovers) Regulations 2011 for Aruna Ganesh
Announcement under Regulation 30 (LODR)-Analyst / Investor Meet - Intimation
05-Jun-2026 | Source : BSESchedule of Institutional Call to be held on June 10 2026
Announcement under Regulation 30 (LODR)-Analyst / Investor Meet - Intimation
22-May-2026 | Source : BSEInvestors/Analyst Call Intimation to be schedule from June 02 2026 till June 05 2026.
Corporate Actions

No Upcoming Board Meetings

Anthem Biosciences Ltd has declared 100% dividend, ex-date: 25 Jun 26

No Splits history available

No Bonus history available

No Rights history available
Quality key factors
Valuation key factors
Technicals key factors
 Technical Indicator Scale: Bearish, Mildly Bearish, Sideways, Mildly Bullish, Bullish Turned
 Shareholding Snapshot : Mar 2026
Shareholding Compare (%holding)
Promoters
None
Held by 27 Schemes (10.12%)
Held by 37 FIIs (1.28%)
Ajay Bhardwaj (42.53%)
Portsmouth Technologies Llc . (2.74%)
9.38%
Quarterly Results Snapshot (Standalone) - Mar'26 - QoQ

QoQ Growth in quarter ended Mar 2026 is 39.83% vs -24.56% in Dec 2025
QoQ Growth in quarter ended Mar 2026 is 88.79% vs -43.50% in Dec 2025
Half Yearly Results Snapshot (Standalone) - Sep'25
Not Applicable: The company has declared_date for only one period
Not Applicable: The company has declared_date for only one period
Nine Monthly Results Snapshot (Standalone) - Dec'25
Not Applicable: The company has declared_date for only one period
Not Applicable: The company has declared_date for only one period
Annual Results Snapshot (Consolidated) - Mar'26

YoY Growth in year ended Mar 2026 is 15.17% vs 29.96% in Mar 2025
YoY Growth in year ended Mar 2026 is 31.14% vs 22.86% in Mar 2025
About Anthem Biosciences Ltd

Company Coordinates


