Apar Inds.

  • Market Cap: Mid Cap
  • Industry: Other Electrical Equipment
  • ISIN: INE372A01015
  • NSEID: APARINDS
  • BSEID: 532259
INR
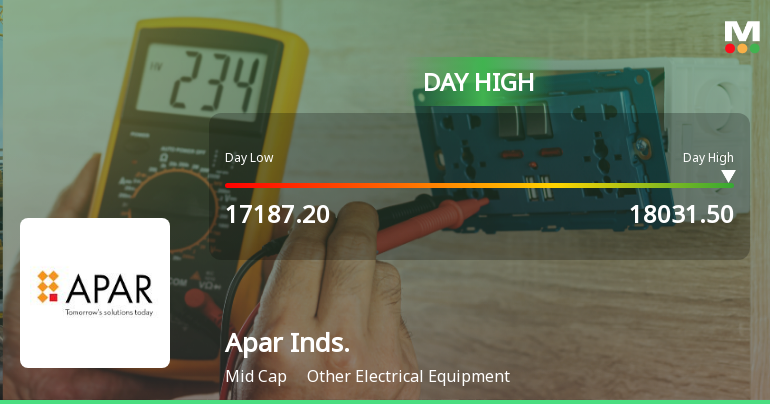
17,908.60
849.25 (4.98%)
BSENSE

Aug 27, 04:01 PM

BSE+NSE Vol: 2.21 lacs

  • Price Points
  • Score
  • Mojo Parameters
  • Total Return
  • News and Corporate Actions
  • Key factors
  • Shareholding
  • Financials
  • CompanyCV
stock-summaryPrice Point
High/Low

1Day

52 Week

Valuation
Technical
Day's Volume

CASH

2.21 lacs (95.69%) Volume

Shareholding (Aug 2026)

FII

11.36%

Held by 315 FIIs

DII

24.89%

Held by 40 DIIs

Promoter

55.42%

Why is Apar Industries Ltd falling/rising?

27-Aug-2026

As of 26-Aug, Apar Industries Ltd's stock price is 17,059.35, reflecting a 0.33% increase. The stock has significantly outperformed the Sensex over various time frames, showing strong year-to-date and one-year returns, despite a slight decline in investor participation.

As of 26-Aug, Apar Industries Ltd is experiencing a rise in its stock price, currently at 17,059.35, reflecting an increase of 56.95 (0.33%). This upward movement can be attributed to several factors. Over the past week, the stock has gained 2.72%, significantly outperforming the Sensex, which only rose by 0.73%. In the last month, the stock has surged by 23.12%, while the benchmark index increased by just 1.86%. <BR><BR>Year-to-date, Apar Industries has shown remarkable performance with a 103.87% increase, contrasting sharply with the Sensex's decline of 9.09%. The stock's one-year return stands at 116.33%, further highlighting its strong performance compared to the broader market, which has seen a decline of 4.10%. Over the last three years, the stock has appreciated by 241.16%, while the Sensex has only increased by 19.40%. <BR><BR>Today's performance indicates that Apar Industries has outperformed its sector by 0.76% and has been on a consecutive gain streak for the last two days, with a total return of 2.34% during this period. Additionally, the stock is trading above its moving averages across various time frames, including the 5-day, 20-day, 50-day, 100-day, and 200-day averages, which is often a positive indicator for investors.<BR><BR>The company also demonstrates strong long-term fundamentals, with an average Return on Equity (ROE) of 20.31% and impressive growth in net sales and operating profit. Recent financial results have shown significant growth, with a 77.8% increase in profit after tax and a 29.13% rise in net sales for the quarter ending June 26. <BR><BR>However, it is important to note that there is a slight decline in investor participation, as evidenced by a 1.76% drop in delivery volume compared to the 5-day average. Despite this, the overall strong performance metrics and positive financial indicators contribute to the rising stock price of Apar Industries Ltd.

View full answer

Who are in the management team of Apar Inds.?

14-Aug-2026

The management team of Apar Industries includes Kushal N Desai (Chairman, Managing Director, and CEO), C N Desai (Managing Director), and several non-executive directors, including Nina Kapasi and Rajesh Sehgal. They are responsible for the company's governance and strategic direction.

The management team of Apar Industries includes the following key individuals:<BR><BR>1. **Kushal N Desai** - Chairman, Managing Director, and CEO<BR>2. **C N Desai** - Managing Director<BR>3. **Sanjaya Kunder** - Company Secretary and Compliance Officer<BR>4. **Nina Kapasi** - Non-Executive and Independent Director<BR>5. **Rajesh Sehgal** - Non-Executive and Independent Director<BR>6. **Rishabh K Desai** - Non-Executive and Non-Independent Director<BR>7. **Kaushal Jaysingh Sampat** - Non-Executive and Independent Director<BR><BR>This team plays a crucial role in the governance and strategic direction of the company.

View full answer

What does Apar Inds. do?

14-Aug-2026

Apar Industries Ltd specializes in electrical and metallurgical engineering, offering value-added products and services. As of June 2026, it reported net sales of ₹6,591 Cr and a net profit of ₹467 Cr, with a market cap of ₹71,493 Cr.

Overview: <BR>Apar Industries Ltd operates in the Other Electrical Equipment industry, focusing on electrical and metallurgical engineering, providing value-added products and services.<BR><BR>History: <BR>Founded in 1958 by Late Shri. Dharmsinh D. Desai, Apar Industries has established itself as a key player in its field. The latest reported quarterly results indicate net sales and net profit for June 2026.<BR><BR>Financial Snapshot: <BR>Net Sales: 6,591 Cr (Quarterly Results - Jun 2026) <BR>Net Profit: 467 Cr (Quarterly Results - Jun 2026) <BR>Market Cap: INR 71,493 Cr (Mid Cap) <BR><BR>Key Metrics: <BR>P/E: 57.00 <BR>Industry P/E: 56 <BR>Dividend Yield: 0.00% <BR>Debt-Equity: 0.03 <BR>Return on Equity: 18.56% <BR>Price to Book: 13.42 <BR><BR>Contact Details: <BR>Address: 301 Panorama Complex, R C Dutt Road Vadodara Gujarat : 390007 <BR>Tel: 91-265-2339906 <BR>Email: com_sec@apar.com <BR>Website: http://www.apar.com

View full answer

Who are the peers of the Apar Inds.?

14-Aug-2026

Peers of Apar Inds. include Waaree Energies, Premier Energies, Diamond Power, Avalon Tech, Genus Power, Vikram Solar, and Ram Ratna Wires. Apar Inds. has the highest 1-year return at 96.80%, while Diamond Power has the lowest at -146.38%.

Peers: The peers of Apar Inds. are Waaree Energies, Premier Energies, Diamond Power, Avalon Tech, Genus Power, Vikram Solar, and Ram Ratna Wires.<BR><BR>Quality Snapshot: Excellent management risk is observed at Waaree Energies, Apar Inds., and Premier Energies, while Average management risk is found at Avalon Tech, Genus Power, Vikram Solar, and Ram Ratna Wires, and the rest. Growth is rated as Excellent for Waaree Energies, Apar Inds., Premier Energies, Genus Power, and Vikram Solar, while Good growth is noted at Avalon Tech and the rest. Capital Structure is rated Excellent for Waaree Energies and Avalon Tech, Good for Apar Inds., Premier Energies, Genus Power, and Vikram Solar, and Below Average for Diamond Power.<BR><BR>Return Snapshot: The peer with the highest 1-year return is Apar Inds. at 96.80%, while Diamond Power has the lowest at 146.38%. Apar Inds.'s return is significantly higher than Diamond Power's. Additionally, Genus Power and Vikram Solar have negative six-month returns.

View full answer

How big is Apar Inds.?

14-Aug-2026

As of 14th August, Apar Industries Ltd has a market capitalization of 67,046.54 Cr, with recent net sales of 24,389.02 Cr and a net profit of 1,181.51 Cr. The latest balance sheet shows shareholder's funds of 4,503.54 Cr and total assets of 11,263.55 Cr.

As of 14th August, Apar Industries Ltd has a market capitalization of 67,046.54 Cr, categorizing it as a Mid Cap company.<BR><BR>In the latest four quarters, Apar Industries reported Net Sales of 24,389.02 Cr and a Net Profit of 1,181.51 Cr.<BR><BR>The latest annual period for the balance sheet is March 2025, showing Shareholder's Funds of 4,503.54 Cr and Total Assets of 11,263.55 Cr.

View full answer

Are Apar Industries Ltd latest results good or bad?

25-Jul-2026

Apar Industries Ltd's latest Q1 FY27 results are strong, with a net profit of ₹467.45 crore (up 77.80% year-on-year) and net sales of ₹6,591.06 crore (up 29.13%). The operating margin improved to 11.54%, indicating enhanced operational efficiency and strong market positioning.

Apar Industries Ltd's latest results for Q1 FY27 are quite strong and can be considered good. The company reported a net profit of ₹467.45 crore, which reflects a remarkable year-on-year growth of 77.80%. Additionally, net sales reached ₹6,591.06 crore, marking a 29.13% increase compared to the same quarter last year.<BR><BR>The operating margin also showed significant improvement, reaching 11.54%, the highest in eight quarters, indicating enhanced operational efficiency. This margin expansion, combined with robust revenue growth, underscores the company's ability to generate higher profitability from its sales.<BR><BR>Overall, the financial performance highlights strong momentum and operational excellence, positioning Apar Industries favorably in the market.

View full answer

Should I buy, sell or hold Apar Industries Ltd?

25-Jul-2026

When is the next results date for Apar Industries Ltd?

14-Jul-2026

The next results date for Apar Industries Ltd is 24 July 2026.

The next results date for Apar Industries Ltd is scheduled for 24 July 2026.

View full answer

Is Apar Inds. technically bullish or bearish?

29-Nov-2025

As of November 28, 2025, the trend is mildly bullish, supported by daily moving averages and weekly MACD, but tempered by mixed signals from monthly indicators, suggesting a cautious bullish sentiment.

As of 28 November 2025, the technical trend has changed from bullish to mildly bullish. The current stance is mildly bullish, supported by the daily moving averages indicating bullish momentum and the weekly MACD also showing a bullish signal. However, the monthly MACD and KST are mildly bearish, which tempers the overall bullish outlook. The RSI on the monthly timeframe is bullish, while the Bollinger Bands indicate a mildly bullish trend on the weekly and bullish on the monthly. Overall, the mixed signals across different timeframes suggest a cautious bullish sentiment.

View full answer

How has been the historical performance of Apar Inds.?

24-Nov-2025

Apar Inds. has shown strong historical growth, with net sales increasing to 18,581.21 Cr in March 2025 from 9,316.57 Cr in March 2022, and operating profit rising to 1,646.82 Cr. Despite a slight decline in profit before tax, the company maintains solid profitability and improved cash flow, with total assets growing significantly.

Answer:<BR>The historical performance of Apar Inds. shows a significant upward trend in net sales and profitability over the years, with net sales reaching 18,581.21 Cr in March 2025, up from 16,152.98 Cr in March 2024 and 14,336.30 Cr in March 2023. The total operating income has similarly increased, reflecting strong revenue growth. Operating profit (PBDIT) also rose to 1,646.82 Cr in March 2025, compared to 1,608.76 Cr in the previous year, indicating a consistent improvement in operational efficiency. However, profit before tax slightly decreased to 1,105.76 Cr in March 2025 from 1,106.47 Cr in March 2024, while profit after tax was 821.42 Cr, a marginal decline from 825.73 Cr in the prior year. The company's total assets grew to 11,263.55 Cr in March 2025, up from 9,615.76 Cr in March 2024, demonstrating robust asset accumulation, while total liabilities also increased to 11,263.55 Cr from 9,615.76 Cr, reflecting a rise in both long-term and short-term borrowings. Cash flow from operating activities showed a positive trend, reaching 1,290.00 Cr in March 2025, a recovery from a negative cash flow in the previous year.<BR><BR>Breakdown:<BR>Apar Inds. has exhibited strong growth in net sales, which increased from 9,316.57 Cr in March 2022 to 18,581.21 Cr in March 2025. This growth is mirrored in total operating income and operating profit, with the latter rising from 547.85 Cr in March 2022 to 1,646.82 Cr in March 2025. Despite a slight decrease in profit before tax in March 2025, the profit after tax remained strong at 821.42 Cr, reflecting the company's ability to maintain profitability amidst rising costs. The total assets of the company have also seen a substantial increase, indicating a solid financial foundation, while total liabilities have risen in tandem, suggesting increased leverage. The cash flow from operating activities has improved significantly, indicating better cash management and operational efficiency, culminating in a closing cash balance of 686.00 Cr in March 2025.

View full answer

Who are the top shareholders of the Apar Inds.?

17-Jul-2025

The top shareholders of Apar Industries include promoter Chaitanya N Desai with 22.7%, mutual funds holding 18.15%, foreign institutional investors at 9.86%, and individual investors at 9.28%, with Axis Mutual Fund Trustee Limited being the largest public shareholder at 3.37%.

The top shareholders of Apar Industries include the promoters, who hold the majority of the shares. The promoter with the highest holding is Chaitanya N Desai, owning 22.7% of the company. In addition to the promoters, mutual funds collectively hold 18.15% through 26 schemes, while foreign institutional investors (FIIs) hold 9.86% across 184 FIIs. The highest public shareholder is Axis Mutual Fund Trustee Limited, with a stake of 3.37%. Individual investors account for 9.28% of the holdings.

View full answer

Is Apar Inds. overvalued or undervalued?

09-Jun-2025

As of April 22, 2025, Apar Industries Ltd. is fairly valued with a PE ratio of 39.79 and an EV to EBITDA of 20.88, having outperformed the Sensex with a 34.77% return over the past month.

As of 22 April 2025, the valuation grade for Apar Industries Ltd. has moved from attractive to fair, indicating a shift in its perceived value. The company is currently fairly valued. Key ratios include a PE ratio of 39.79, an EV to EBITDA of 20.88, and a ROCE of 34.34%. <BR><BR>When compared to peers, Apar Industries Ltd. has a similar PE ratio to its peer group, which is also around 39.79, and an EV to EBITDA of 20.88, aligning closely with industry standards. The company's recent stock performance has outpaced the Sensex over the past month, with a return of 34.77% compared to the Sensex's 3.83%, reflecting strong market interest despite the overall valuation adjustment.

View full answer

What is the bonus history of the Apar Inds.?

06-Jun-2025

Apar Industries Ltd announced a 1:3 bonus issue on January 11, 2007, with a record date of January 12, 2007, meaning shareholders received one additional share for every three shares held.

Apar Industries Ltd has a bonus history that includes a 1:3 bonus issue announced on January 11, 2007. The record date for this bonus was January 12, 2007. This means that for every three shares held, shareholders received one additional share as a bonus.

View full answer

Has Apar Inds. declared dividend?

06-Jun-2025

Apar Industries Ltd has declared a 510% dividend, amounting to ₹51 per share, with an ex-date of August 20, 2024. While recent returns have varied, the company has shown substantial long-term growth, particularly in price returns over the past five years.

Apar Industries Ltd has declared a 510% dividend.<BR><BR>Dividend Details:<BR>- Percentage announced: 510%<BR>- Amount per share: 51<BR>- Ex-date: 20 Aug 24<BR><BR>Dividend Yield: 0.63%.<BR><BR>Total Returns by Period:<BR>In the last 6 months, the price return was -19.56%, with a dividend return of 0%, resulting in a total return of -19.56%.<BR><BR>Over the past year, the price return was 4.88%, the dividend return was 0.63%, leading to a total return of 5.51%.<BR><BR>In the 2-year period, the price return reached 190.35%, with a dividend return of 2.94%, culminating in a total return of 193.29%.<BR><BR>For the 3-year period, the price return was an impressive 943.6%, while the dividend return was 11.54%, resulting in a total return of 955.14%.<BR><BR>In the last 4 years, the price return soared to 1382.32%, with a dividend return of 22.29%, achieving a total return of 1404.61%.<BR><BR>Finally, over the past 5 years, the price return was 2393.53%, with a dividend return of 35.06%, leading to a total return of 2428.59%.<BR><BR>Overall, Apar Industries Ltd has declared a significant dividend, and while recent returns have been mixed, the long-term performance shows substantial growth, particularly in price returns over the years.

View full answer
iScoreScore
Part of MojoOne Strategy
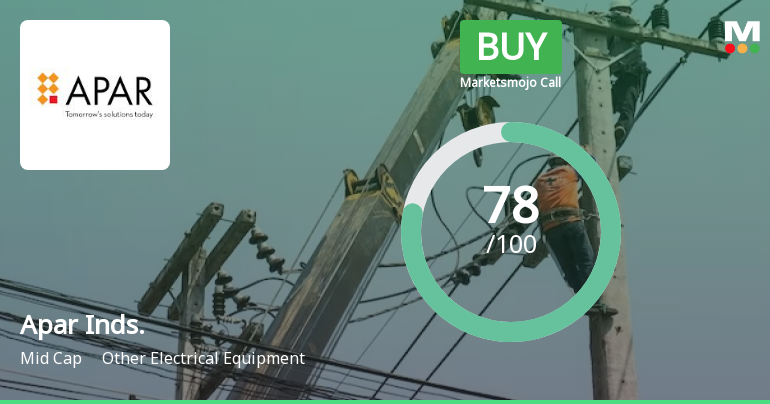
Click here to find our call on this stock
Strong Sell
Sell
Hold
Buy
Strong Buy

Dashboard

1

Strong Long Term Fundamental Strength with an average Return on Equity (ROE) of 20.31%

  • Healthy long term growth as Net Sales has grown by an annual rate of 28.71% and Operating profit at 36.72%
  • Company has a Debt to Equity ratio (avg) of 0.01 times
2

Positive results in Jun 26

3

Company is among the highest 1% of companies rated by MarketsMojo across all 4,000 stocks

 
4

Market Beating performance in long term as well as near term

stock-summaryMojo Parameters

Mojo Parameters

Loading Valuation Snapshot...

Stock DNA

stock-summary
Industry

Other Electrical Equipment

stock-summary
Market cap

INR 73,402 Cr (Mid Cap)

stock-summary
P/E

59.00

stock-summary
Industry P/E

53

stock-summary
Dividend Yield

0.00%

stock-summary
Debt Equity

0.03

stock-summary
Return on Equity

18.56%

stock-summary
Price to Book

13.27

Revenue and Profits:
Net Sales:
6,591 Cr
(Quarterly Results - Jun 2026)
Net Profit:
467 Cr
stock-summaryTotal Returns
Total Returns (Price + Dividend) stock-summary
Dividend Yield (0%)
TimePeriod
Price Return
Dividend Return
Total Return
3 Months
33.15%
0%
33.15%
6 Months
60.21%
0%
60.21%
1 Year
127.1%
0%
127.1%
2 Years
99.38%
0.57%
99.95%
3 Years
258.14%
2.08%
260.22%
4 Years
1232.24%
11.15%
1243.39%
5 Years
2830.07%
24.24%
2854.31%

Latest dividend: 51 per share ex-dividend date: Jul-29-2025

Risk Adjusted Returns v/s stock-summary
Returns Beta
Icon
Beta has not been calculated since enough price history is not available
stock-summaryNews & Corporate Actions

News

Apar Industries Gains 0.62%: 4 Key Factors Driving the Week’s Momentum

Announcements stock-summary

Intimation Of Record Date

25-Aug-2026 | Source : BSE

Purpose of Record Date :

Reg. 34 (1) Annual Report.

25-Aug-2026 | Source : BSE

Submission of Integrated Annual Report 2025-26 of APAR Industries Limited.

Submission Of Notice Of The 37Th Annual General Meeting (AGM) Scheduled On Monday September 21 2026

25-Aug-2026 | Source : BSE

Submission of Notice of the 37th Annual General Meeting (AGM) scheduled on Monday September 21 2026

Corporate Actions stock-summary

stock-summary
BOARD MEETING

No Upcoming Board Meetings

stock-summary
DIVIDEND

Apar Industries Ltd has declared 510% dividend, ex-date: 29 Jul 25

stock-summary
SPLITS

No Splits history available

stock-summary
BONUS

Apar Industries Ltd has announced 1:3 bonus issue, ex-date: 11 Jan 07

stock-summary
RIGHTS

No Rights history available

stock-summaryKey Factors

Quality key factors stock-summary

Factor
Value
Sales Growth (5y)
28.71%
EBIT Growth (5y)
36.72%
EBIT to Interest (avg)
3.75
Debt to EBITDA (avg)
0.45
Net Debt to Equity (avg)
0.03
Sales to Capital Employed (avg)
4.32
Tax Ratio
25.23%
Dividend Payout Ratio
24.94%
Pledged Shares
0
Institutional Holding
36.24%
ROCE (avg)
36.71%
ROE (avg)
20.31%

Valuation key factors

Factor
Value
P/E Ratio
59
Industry P/E
53
Price to Book Value
13.27
EV to EBIT
35.84
EV to EBITDA
33.06
EV to Capital Employed
12.88
EV to Sales
2.94
PEG Ratio
1.91
Dividend Yield
NA
ROCE (Latest)
30.58%
ROE (Latest)
18.56%

Technicals key factors

Indicator
Weekly
Monthly
MACD
Bullish
Bullish
RSI
No Signal
No Signal
Bollinger Bands
Bullish
Bullish
Moving Averages
Bullish (Daily)
KST
Mildly Bearish
Bullish
Dow Theory
No Trend
Bullish
OBV
Mildly Bearish
Bullish
stock-summary Technical Indicator Scale: Bearish, Mildly Bearish, Sideways, Mildly Bullish, Bullish  Turned 
stock-summaryShareholding
Shareholding Snapshot : Aug 2026stock-summary
Shareholding Compare (%holding) stock-summary
Majority shareholders

Promoters

Pledged Promoter Holdings

None

Mutual Funds

Held by 38 Schemes (22.28%)

FIIs

Held by 315 FIIs (11.36%)

Promoter with highest holding

Chaitanya N Desai (21.78%)

Highest Public shareholder

Axis Mutual Fund Trustee Limited A/c Axis Mutual Fund A/c Axis Midcap Fund (4.59%)

Individual Investors Holdings

6.57%

stock-summaryFinancial
[
  {
    "link": "quarterly",
    "btn_text": "All Quarterly Results",
    "header": "Quarterly Results Snapshot (Consolidated) - Jun'26 - YoY",
    "rhs": [
      {
        "prefix": "Net Sales ",
        "suffix": "YoY Growth in quarter ended Jun 2026 is 29.13% vs 27.27% in Jun 2025",
        "dir": 1
      },
      {
        "prefix": "Consolidated Net Profit ",
        "suffix": "YoY Growth in quarter ended Jun 2026 is 77.80% vs 29.81% in Jun 2025",
        "dir": 1
      }
    ],
    "table": {
      "header": [
        "Jun'26",
        "Jun'25",
        "Change(%)"
      ],
      "body": [
        {
          "field": "Net Sales",
          "val1": "6,591.06",
          "val2": "5,104.16",
          "chgp": "29.13%",
          "chgp_class": "positive"
        },
        {
          "field": "Operating Profit (PBDIT) excl Other Income",
          "val1": "757.58",
          "val2": "452.25",
          "chgp": "67.51%",
          "chgp_class": "positive"
        },
        {
          "field": "Interest",
          "val1": "123.17",
          "val2": "86.32",
          "chgp": "42.69%",
          "chgp_class": "negative"
        },
        {
          "field": "Exceptional Items",
          "val1": "0.00",
          "val2": "0.00",
          "chgp": "",
          "chgp_class": "neutral"
        },
        {
          "field": "Consolidate Net Profit",
          "val1": "467.45",
          "val2": "262.91",
          "chgp": "77.80%",
          "chgp_class": "positive"
        },
        {
          "field": "Operating Profit Margin (Excl OI)",
          "val1": "11.54%",
          "val2": "8.90%",
          "chgp": "2.64%",
          "chgp_class": "positive"
        }
      ]
    }
  },
  {
    "link": "half-yearly",
    "btn_text": "All Half Yearly Results",
    "header": "Half Yearly Results Snapshot (Consolidated) - Sep'25",
    "rhs": [
      {
        "prefix": "Net Sales ",
        "suffix": " Growth in half year ended Sep 2025 is 25.01% vs 12.42% in Sep 2024",
        "dir": 1
      },
      {
        "prefix": "Consolidated Net Profit ",
        "suffix": " Growth in half year ended Sep 2025 is 29.82% vs 6.76% in Sep 2024",
        "dir": 1
      }
    ],
    "table": {
      "header": [
        "Sep'25",
        "Sep'24",
        "Change(%)"
      ],
      "body": [
        {
          "field": "Net Sales",
          "val1": "10,819.58",
          "val2": "8,655.03",
          "chgp": "25.01%",
          "chgp_class": "positive"
        },
        {
          "field": "Operating Profit (PBDIT) excl Other Income",
          "val1": "913.16",
          "val2": "732.17",
          "chgp": "24.72%",
          "chgp_class": "positive"
        },
        {
          "field": "Interest",
          "val1": "194.22",
          "val2": "190.91",
          "chgp": "1.73%",
          "chgp_class": "negative"
        },
        {
          "field": "Exceptional Items",
          "val1": "0.00",
          "val2": "0.00",
          "chgp": "",
          "chgp_class": "neutral"
        },
        {
          "field": "Consolidate Net Profit",
          "val1": "514.61",
          "val2": "396.41",
          "chgp": "29.82%",
          "chgp_class": "positive"
        },
        {
          "field": "Operating Profit Margin (Excl OI)",
          "val1": "8.47%",
          "val2": "8.51%",
          "chgp": "-0.04%",
          "chgp_class": "negative"
        }
      ]
    }
  },
  {
    "link": "nine-monthly",
    "btn_text": "All Nine Monthly Results",
    "header": "Nine Monthly Results Snapshot (Consolidated) - Dec'25",
    "rhs": [
      {
        "prefix": "Net Sales ",
        "suffix": "YoY Growth in nine months ended Dec 2025 is 21.90% vs 14.21% in Dec 2024",
        "dir": 1
      },
      {
        "prefix": "Consolidated Net Profit ",
        "suffix": "YoY Growth in nine months ended Dec 2025 is 26.64% vs -2.98% in Dec 2024",
        "dir": 1
      }
    ],
    "table": {
      "header": [
        "Dec'25",
        "Dec'24",
        "Change(%)"
      ],
      "body": [
        {
          "field": "Net Sales",
          "val1": "16,299.31",
          "val2": "13,371.45",
          "chgp": "21.90%",
          "chgp_class": "positive"
        },
        {
          "field": "Operating Profit (PBDIT) excl Other Income",
          "val1": "1,365.22",
          "val2": "1,088.28",
          "chgp": "25.45%",
          "chgp_class": "positive"
        },
        {
          "field": "Interest",
          "val1": "300.32",
          "val2": "309.26",
          "chgp": "-2.89%",
          "chgp_class": "positive"
        },
        {
          "field": "Exceptional Items",
          "val1": "-24.99",
          "val2": "0.00",
          "chgp": "",
          "chgp_class": "neutral"
        },
        {
          "field": "Consolidate Net Profit",
          "val1": "723.53",
          "val2": "571.33",
          "chgp": "26.64%",
          "chgp_class": "positive"
        },
        {
          "field": "Operating Profit Margin (Excl OI)",
          "val1": "8.38%",
          "val2": "8.14%",
          "chgp": "0.24%",
          "chgp_class": "positive"
        }
      ]
    }
  },
  {
    "link": "annual",
    "btn_text": "All Annual Results",
    "header": "Annual Results Snapshot (Consolidated) - Mar'26",
    "rhs": [
      {
        "prefix": "Net Sales ",
        "suffix": "YoY Growth in year ended Mar 2026 is 23.25% vs 15.03% in Mar 2025",
        "dir": 1
      },
      {
        "prefix": "Consolidated Net Profit ",
        "suffix": "YoY Growth in year ended Mar 2026 is 18.95% vs -0.46% in Mar 2025",
        "dir": 1
      }
    ],
    "table": {
      "header": [
        "Mar'26",
        "Mar'25",
        "Change(%)"
      ],
      "body": [
        {
          "field": "Net Sales",
          "val1": "22,902.12",
          "val2": "18,581.21",
          "chgp": "23.25%",
          "chgp_class": "positive"
        },
        {
          "field": "Operating Profit (PBDIT) excl Other Income",
          "val1": "1,875.93",
          "val2": "1,566.20",
          "chgp": "19.78%",
          "chgp_class": "positive"
        },
        {
          "field": "Interest",
          "val1": "437.11",
          "val2": "408.91",
          "chgp": "6.90%",
          "chgp_class": "negative"
        },
        {
          "field": "Exceptional Items",
          "val1": "-32.53",
          "val2": "0.00",
          "chgp": "",
          "chgp_class": "neutral"
        },
        {
          "field": "Consolidate Net Profit",
          "val1": "976.93",
          "val2": "821.30",
          "chgp": "18.95%",
          "chgp_class": "positive"
        },
        {
          "field": "Operating Profit Margin (Excl OI)",
          "val1": "8.22%",
          "val2": "8.47%",
          "chgp": "-0.25%",
          "chgp_class": "negative"
        }
      ]
    }
  }
]

Quarterly Results Snapshot (Consolidated) - Jun'26 - YoYstock-summary

Jun'26
Jun'25
Change(%)
Net Sales
6,591.06
5,104.16
29.13%
Operating Profit (PBDIT) excl Other Income
757.58
452.25
67.51%
Interest
123.17
86.32
42.69%
Exceptional Items
0.00
0.00
Consolidate Net Profit
467.45
262.91
77.80%
Operating Profit Margin (Excl OI)
11.54%
8.90%
2.64%
Values in Rs Cr.
Direction Arrows
Net Sales

YoY Growth in quarter ended Jun 2026 is 29.13% vs 27.27% in Jun 2025

Direction Arrows
Consolidated Net Profit

YoY Growth in quarter ended Jun 2026 is 77.80% vs 29.81% in Jun 2025

Half Yearly Results Snapshot (Consolidated) - Sep'25stock-summary

Sep'25
Sep'24
Change(%)
Net Sales
10,819.58
8,655.03
25.01%
Operating Profit (PBDIT) excl Other Income
913.16
732.17
24.72%
Interest
194.22
190.91
1.73%
Exceptional Items
0.00
0.00
Consolidate Net Profit
514.61
396.41
29.82%
Operating Profit Margin (Excl OI)
8.47%
8.51%
-0.04%
Values in Rs Cr.
Direction Arrows
Net Sales

Growth in half year ended Sep 2025 is 25.01% vs 12.42% in Sep 2024

Direction Arrows
Consolidated Net Profit

Growth in half year ended Sep 2025 is 29.82% vs 6.76% in Sep 2024

Nine Monthly Results Snapshot (Consolidated) - Dec'25stock-summary

Dec'25
Dec'24
Change(%)
Net Sales
16,299.31
13,371.45
21.90%
Operating Profit (PBDIT) excl Other Income
1,365.22
1,088.28
25.45%
Interest
300.32
309.26
-2.89%
Exceptional Items
-24.99
0.00
Consolidate Net Profit
723.53
571.33
26.64%
Operating Profit Margin (Excl OI)
8.38%
8.14%
0.24%
Values in Rs Cr.
Direction Arrows
Net Sales

YoY Growth in nine months ended Dec 2025 is 21.90% vs 14.21% in Dec 2024

Direction Arrows
Consolidated Net Profit

YoY Growth in nine months ended Dec 2025 is 26.64% vs -2.98% in Dec 2024

Annual Results Snapshot (Consolidated) - Mar'26stock-summary

Mar'26
Mar'25
Change(%)
Net Sales
22,902.12
18,581.21
23.25%
Operating Profit (PBDIT) excl Other Income
1,875.93
1,566.20
19.78%
Interest
437.11
408.91
6.90%
Exceptional Items
-32.53
0.00
Consolidate Net Profit
976.93
821.30
18.95%
Operating Profit Margin (Excl OI)
8.22%
8.47%
-0.25%
Values in Rs Cr.
Direction Arrows
Net Sales

YoY Growth in year ended Mar 2026 is 23.25% vs 15.03% in Mar 2025

Direction Arrows
Consolidated Net Profit

YoY Growth in year ended Mar 2026 is 18.95% vs -0.46% in Mar 2025

stock-summaryCompany CV
About Apar Industries Ltd stock-summary
stock-summary
Apar Industries Ltd
Mid Cap
Other Electrical Equipment
Apar Industries Limited, founded by Late Shri. Dharmsinh D. Desai in the year 1958 is one among the established companies in India, operating in the diverse fields of electrical and metallurgical engineering offering value added products and services in Power Transmission Conductors, Petroleum Specialty Oils and Power & Telecom Cables.
Company Coordinates stock-summary
Company Details
301 Panorama Complex, R C Dutt Road Vadodara Gujarat : 390007
stock-summary
Tel: 91-265-2339906
stock-summary
com_sec@apar.com
Registrar Details
MCS Ltd , Neelam Apartment , 88 Sampatrao Colony, Above Chappan Bhog Sweets, Vadodara