
Compare Apollo Finvest with Similar Stocks
Stock DNA
Non Banking Financial Company (NBFC)
INR 131 Cr (Micro Cap)
18.00
21
0.00%
0.23
9.36%
1.74
Total Returns (Price + Dividend) 
Apollo Finvest for the last several years.
Risk Adjusted Returns v/s
Returns Beta

News
Apollo Finvest (India) Ltd is Rated Sell
Apollo Finvest (India) Ltd is rated 'Sell' by MarketsMOJO, with this rating last updated on 10 Nov 2025. However, the analysis and financial metrics discussed here reflect the stock's current position as of 27 June 2026, providing investors with an up-to-date view of its fundamentals, returns, and market performance.
Read full news article
Apollo Finvest (India) Ltd is Rated Sell
Apollo Finvest (India) Ltd is rated 'Sell' by MarketsMOJO. This rating was last updated on 10 Nov 2025. However, the analysis and financial metrics discussed here reflect the stock's current position as of 16 June 2026, providing investors with an up-to-date perspective on the company’s fundamentals, valuation, financial trends, and technical outlook.
Read full news article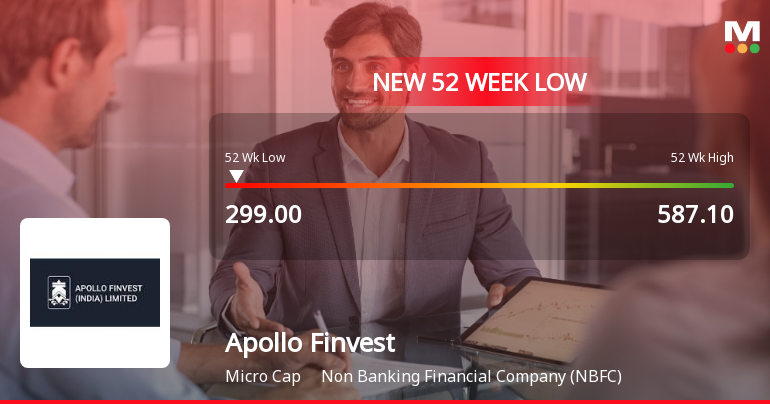
Apollo Finvest Falls to 52-Week Low of Rs 299 as Sell-Off Deepens
A sharp decline over the past two sessions has dragged Apollo Finvest (India) Ltd to a fresh 52-week low of Rs 299 on 8 June 2026, marking a significant 49.1% drop from its peak of Rs 587.1 within the last year. This downturn comes amid a broader market weakness but is notably more severe than the BSE Sensex’s 10.54% decline over the same period.
Read full news article Announcements
Shareholder Meeting / Postal Ballot-Outcome of Postal_Ballot
23-Jun-2026 | Source : BSEOutcome of Postal Ballot
Shareholder Meeting / Postal Ballot-Scrutinizers Report
23-Jun-2026 | Source : BSEPostal Ballot - Scrutinizers report along with Voting Result
Announcement Under Regulation 30 (LODR)- (Material Update)
19-Jun-2026 | Source : BSEIntimation under regulation 30 of Securities and Exchange Board of India (Listing Obligation and Disclosure Requirements) Regulations 2015 (Listing Regulations)- Material Update
Corporate Actions

No Upcoming Board Meetings

No Dividend history available

No Splits history available

No Bonus history available

No Rights history available
Quality key factors
Valuation key factors
Technicals key factors
 Technical Indicator Scale: Bearish, Mildly Bearish, Sideways, Mildly Bullish, Bullish Turned
 Shareholding Snapshot : Mar 2026
Shareholding Compare (%holding)
Promoters
None
Held by 1 Schemes (0.02%)
Held by 2 FIIs (0.29%)
Anju Ramesh Innani (28.25%)
Mahavir Suresh Bafna Huf . (1.32%)
23.58%
Quarterly Results Snapshot (Standalone) - Mar'26 - QoQ

QoQ Growth in quarter ended Mar 2026 is 26.42% vs -10.55% in Dec 2025

QoQ Growth in quarter ended Mar 2026 is -41.53% vs 5.17% in Dec 2025
Half Yearly Results Snapshot (Standalone) - Sep'25
Growth in half year ended Sep 2025 is -28.54% vs 72.06% in Sep 2024
Growth in half year ended Sep 2025 is -14.92% vs 0.42% in Sep 2024
Nine Monthly Results Snapshot (Standalone) - Dec'25
YoY Growth in nine months ended Dec 2025 is -32.91% vs 70.81% in Dec 2024
YoY Growth in nine months ended Dec 2025 is -4.70% vs -14.90% in Dec 2024
Annual Results Snapshot (Standalone) - Mar'26
YoY Growth in year ended Mar 2026 is -31.59% vs 51.53% in Mar 2025
YoY Growth in year ended Mar 2026 is -3.74% vs -9.86% in Mar 2025
About Apollo Finvest (India) Ltd

Company Coordinates


