
Compare Apollo Pipes with Similar Stocks
Stock DNA
Plastic Products - Industrial
INR 2,122 Cr (Micro Cap)
284.00
36
0.15%
0.05
0.91%
2.63
Total Returns (Price + Dividend) 
Latest dividend: 0.7 per share ex-dividend date: Sep-04-2025
Risk Adjusted Returns v/s
Returns Beta

News
Apollo Pipes Ltd Downgraded to Sell Amid Weak Financials and Mixed Technical Signals
Apollo Pipes Ltd has been downgraded from a Hold to a Sell rating following a comprehensive reassessment of its quality, valuation, financial trend, and technical indicators. Despite some positive signals such as promoter confidence and market-beating returns over the past year, the company’s deteriorating financial performance and mixed technical outlook have prompted a cautious stance from analysts.
Read full news article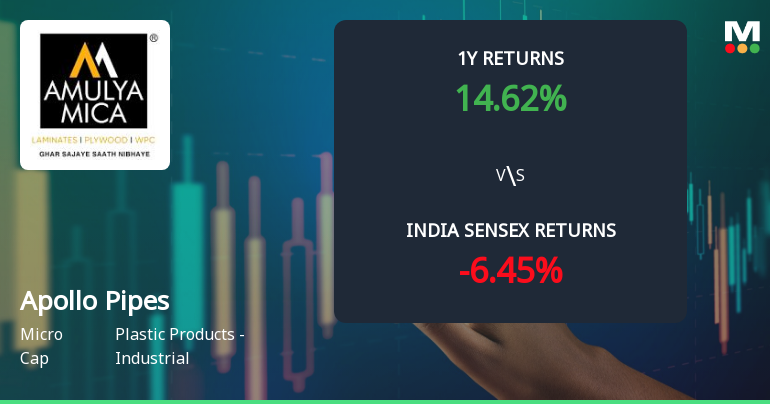
Apollo Pipes Ltd Technical Momentum Shifts Amid Mixed Market Signals
Apollo Pipes Ltd has experienced a nuanced shift in its technical momentum, moving from a bullish to a mildly bullish stance as of late June 2026. Despite a modest decline in daily price, the stock’s technical indicators present a complex picture, reflecting both resilience and caution within the micro-cap plastic products sector.
Read full news article
Apollo Pipes Ltd is Rated Hold by MarketsMOJO
Apollo Pipes Ltd is rated 'Hold' by MarketsMOJO, with this rating last updated on 09 April 2026. While the rating change occurred on that date, the analysis and financial metrics discussed here reflect the company’s current position as of 15 June 2026, providing investors with the most up-to-date view of the stock’s fundamentals, returns, and technical outlook.
Read full news article Announcements
Closure of Trading Window
24-Jun-2026 | Source : BSEThe Trading window dealing in Equity share of the company shall remain closed from July 1 2026 till the expiry of 48 hours after the declaration of the financial result of the company for the quater ended June 30 2026.
Compliances-Reg.24(A)-Annual Secretarial Compliance
25-May-2026 | Source : BSEAnnual Secretarial Compliance Report for the year ended March 31 2026.
Announcement under Regulation 30 (LODR)-Change in Management
20-May-2026 | Source : BSEResignation of Mr. Parag Dadeech Chief Operating Officer and Senior Management Personnel of the Company.
Corporate Actions

No Upcoming Board Meetings

Apollo Pipes Ltd has declared 7% dividend, ex-date: 04 Sep 25

No Splits history available

Apollo Pipes Ltd has announced 2:1 bonus issue, ex-date: 02 Dec 21

No Rights history available
Quality key factors
Valuation key factors
Technicals key factors
 Technical Indicator Scale: Bearish, Mildly Bearish, Sideways, Mildly Bullish, Bullish Turned
 Shareholding Snapshot : Mar 2026
Shareholding Compare (%holding)
Promoters
None
Held by 3 Schemes (8.06%)
Held by 29 FIIs (2.22%)
Meenakshi Gupta (23.4%)
Franklin India Small Cap Fund (4.59%)
27.56%
Quarterly Results Snapshot (Consolidated) - Mar'26 - QoQ

QoQ Growth in quarter ended Mar 2026 is 40.39% vs 4.87% in Dec 2025
QoQ Growth in quarter ended Mar 2026 is 130.37% vs -301.23% in Dec 2025
Half Yearly Results Snapshot (Consolidated) - Sep'25
Not Applicable: The company has declared_date for only one period
Not Applicable: The company has declared_date for only one period
Nine Monthly Results Snapshot (Consolidated) - Dec'25
Not Applicable: The company has declared_date for only one period
Not Applicable: The company has declared_date for only one period
Annual Results Snapshot (Consolidated) - Mar'26

YoY Growth in year ended Mar 2026 is -6.49% vs 19.73% in Mar 2025
YoY Growth in year ended Mar 2026 is -77.06% vs -23.43% in Mar 2025
About Apollo Pipes Ltd

Company Coordinates


