
Compare Aptech with Similar Stocks
Dashboard
The company is Net-Debt Free
Healthy long term growth as Net Sales has grown by an annual rate of 33.64% and Operating profit at 52.03%
With ROE of 10.2, it has a Attractive valuation with a 2.6 Price to Book Value
Despite the size of the company, domestic mutual funds hold only 0.01% of the company
Consistent Underperformance against the benchmark over the last 3 years
Stock DNA
Other Consumer Services
INR 626 Cr (Micro Cap)
25.00
19
3.96%
-0.09
10.21%
2.65
Total Returns (Price + Dividend) 
Latest dividend: 4.487500000000001 per share ex-dividend date: May-27-2026
Risk Adjusted Returns v/s
Returns Beta

News
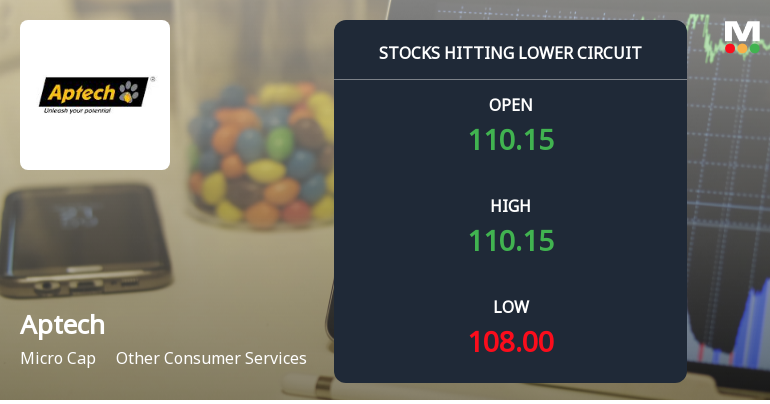
Aptech Ltd Locks at Lower Circuit With 5% Loss — Sellers Queue, No Buyers in Sight
At Rs 108.06, sellers were still queuing — but there were no buyers willing to take the other side. Aptech Ltd locked at its lower circuit of 5% on 19 Jun 2026, with unfilled sell orders and a frozen price that capped losses for the day.
Read full news article
Aptech Ltd Locks at Lower Circuit With 5% Loss — Sellers Queue, No Buyers in Sight
At Rs 113.74, sellers were still queuing — but there were no buyers willing to take the other side. Aptech Ltd locked at its lower circuit of 5% on 18 Jun 2026, with unfilled sell orders and a frozen price, reflecting persistent selling pressure in a micro-cap stock with limited liquidity.
Read full news article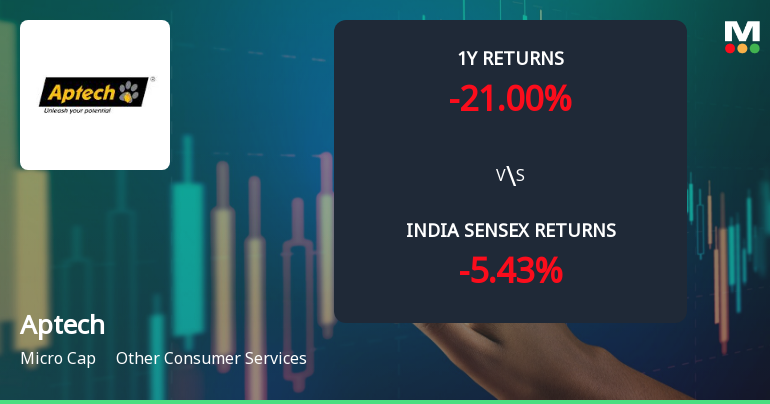
Aptech Ltd Technical Momentum Shifts to Bullish Amid Mixed Returns
Aptech Ltd has witnessed a notable shift in its technical momentum, moving from a mildly bullish stance to a more confident bullish trend across key indicators. Despite a recent dip in price, the stock’s technical parameters suggest improving momentum, supported by positive signals from MACD, moving averages, and volume-based indicators. This development comes amid a mixed performance record relative to the Sensex, highlighting the importance of technical analysis in assessing Aptech’s near-term prospects.
Read full news article Announcements
Compliances-Reg.24(A)-Annual Secretarial Compliance
27-May-2026 | Source : BSERegulation 24A of the SEBI (Listing Obligations and Disclosure Requirements) Regulation 2015
Announcement under Regulation 30 (LODR)-Award_of_Order_Receipt_of_Order
26-May-2026 | Source : BSEDisclosure under Regulation 30 of SEBI ( Listing Obligations and Disclosure Requirements) Regulations 2015
Announcement under Regulation 30 (LODR)-Award_of_Order_Receipt_of_Order
26-May-2026 | Source : BSEDisclosure under regulation 30 of SEBI (Listing Obligations and Disclosure Requirements) Regulations 2015
Corporate Actions

No Upcoming Board Meetings

Aptech Ltd has declared 45% dividend, ex-date: 27 May 26

No Splits history available

Aptech Ltd has announced 2:5 bonus issue, ex-date: 14 Jul 23

No Rights history available
Quality key factors
Valuation key factors
Technicals key factors
 Technical Indicator Scale: Bearish, Mildly Bearish, Sideways, Mildly Bullish, Bullish Turned
 Shareholding Snapshot : Mar 2026
Shareholding Compare (%holding)
Non Institution
None
Held by 1 Schemes (0.0%)
Held by 15 FIIs (0.66%)
Jhunjhunwala Rakesh Radheshyam(late) (0.0%)
None
39.65%
Quarterly Results Snapshot (Consolidated) - Mar'26 - QoQ

QoQ Growth in quarter ended Mar 2026 is -19.04% vs 1.65% in Dec 2025
QoQ Growth in quarter ended Mar 2026 is -79.21% vs 32.51% in Dec 2025
Half Yearly Results Snapshot (Consolidated) - Sep'25

Growth in half year ended Sep 2025 is 10.43% vs -0.39% in Sep 2024
Growth in half year ended Sep 2025 is 24.81% vs -45.96% in Sep 2024
Nine Monthly Results Snapshot (Consolidated) - Dec'25
YoY Growth in nine months ended Dec 2025 is 14.94% vs 2.61% in Dec 2024
YoY Growth in nine months ended Dec 2025 is 53.75% vs -46.22% in Dec 2024
Annual Results Snapshot (Consolidated) - Mar'26
YoY Growth in year ended Mar 2026 is 9.42% vs 5.33% in Mar 2025
YoY Growth in year ended Mar 2026 is 23.27% vs -34.30% in Mar 2025
About Aptech Ltd

Company Coordinates


