
Compare Aravali Sec with Similar Stocks
Dashboard
With a Negative Book Value, the company has a Weak Long Term Fundamental Strength
- Poor long term growth as Net Sales has grown by an annual rate of -24.21% and Operating profit at 0%
Flat results in Mar 26
Risky - Negative Book Value
Below par performance in long term as well as near term
Stock DNA
Trading & Distributors
INR 6 Cr (Micro Cap)
NA (Loss Making)
21
0.00%
-3.35
15.45%
-5.22
Total Returns (Price + Dividend) 
Aravali Sec for the last several years.
Risk Adjusted Returns v/s
Returns Beta

News

Aravali Securities & Finance Ltd Downgraded to Strong Sell Amid Technical and Fundamental Weakness
Aravali Securities & Finance Ltd has seen its investment rating downgraded from Sell to Strong Sell, reflecting deteriorating technical indicators and persistent fundamental challenges. The micro-cap stock’s recent performance, coupled with a negative book value and flat financial trends, has prompted a reassessment of its quality, valuation, financial trend, and technical outlook.
Read full news article
Aravali Securities & Finance Ltd Upgraded to Sell on Technical Improvement Despite Fundamental Concerns
Aravali Securities & Finance Ltd has seen its investment rating upgraded from Strong Sell to Sell as of 19 Jun 2026, driven primarily by a shift in technical indicators despite persistent fundamental weaknesses. The micro-cap trading and distribution company’s recent performance and valuation metrics present a mixed picture, prompting a nuanced reassessment of its outlook.
Read full news article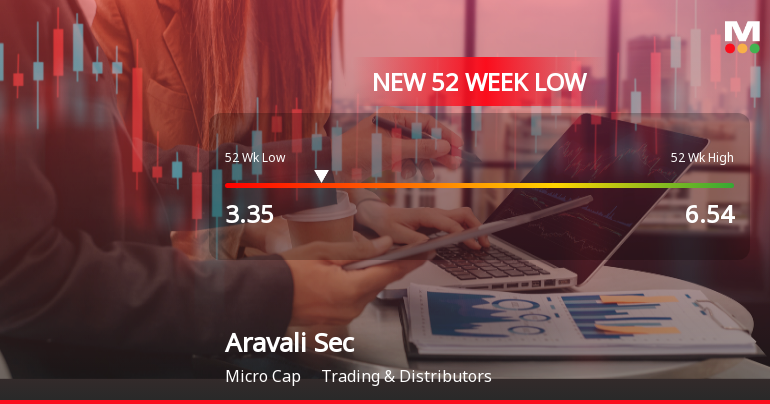
Five Consecutive Losses Push Aravali Securities & Finance Ltd to a New 52-Week Low
For the fifth consecutive session, Aravali Securities & Finance Ltd closed lower, slipping to a fresh 52-week low of Rs 3.35 on 15 Jun 2026. This decline comes despite a broadly positive market backdrop, highlighting stock-specific pressures that have weighed heavily on the micro-cap trading and distribution company.
Read full news article Announcements
Compliances-Certificate under Reg. 74 (5) of SEBI (DP) Regulations 2018
08-Jul-2026 | Source : BSECertificate Under Regulation 74(5) of SEBI (DP) Regulations 2018
Shareholder Meeting / Postal Ballot-Outcome of AGM
04-Jul-2026 | Source : BSEOutcome of 46TH AGM for the year ended 2025-2026
Shareholder Meeting / Postal Ballot-Outcome of AGM
04-Jul-2026 | Source : BSERevised Outcome of 46th AGM for the year ended 2025-2026
Corporate Actions

No Upcoming Board Meetings

No Dividend history available

No Splits history available

No Bonus history available

No Rights history available
Quality key factors
Valuation key factors
Technicals key factors
 Technical Indicator Scale: Bearish, Mildly Bearish, Sideways, Mildly Bullish, Bullish Turned
 Shareholding Snapshot : Jun 2026
Shareholding Compare (%holding)
Promoters
None
Held by 0 Schemes
Held by 0 FIIs
Chandra Lekha Poddar (51.92%)
Anand Kumar Kesari (1.05%)
41.31%
Quarterly Results Snapshot (Standalone) - Mar'26 - QoQ
QoQ Growth in quarter ended Mar 2026 is 0.00% vs 0.00% in Dec 2025

QoQ Growth in quarter ended Mar 2026 is 0.00% vs -100.00% in Dec 2025
Half Yearly Results Snapshot (Standalone) - Sep'25
Growth in half year ended Sep 2025 is 0.00% vs 0.00% in Sep 2024
Growth in half year ended Sep 2025 is 40.00% vs 37.50% in Sep 2024
Nine Monthly Results Snapshot (Standalone) - Dec'25
YoY Growth in nine months ended Dec 2025 is 0.00% vs 0.00% in Dec 2024

YoY Growth in nine months ended Dec 2025 is 38.10% vs 40.00% in Dec 2024
Annual Results Snapshot (Standalone) - Mar'26
YoY Growth in year ended Mar 2026 is 0.00% vs 0.00% in Mar 2025
YoY Growth in year ended Mar 2026 is 40.00% vs 31.82% in Mar 2025
About Aravali Securities & Finance Ltd

Company Coordinates


