
Compare ARC Finance with Similar Stocks
Stock DNA
Non Banking Financial Company (NBFC)
INR 48 Cr (Micro Cap)
67.00
21
0.00%
0.14
0.73%
0.48
Total Returns (Price + Dividend) 
ARC Finance for the last several years.
Risk Adjusted Returns v/s
Returns Beta

News

ARC Finance Ltd is Rated Strong Sell
ARC Finance Ltd is rated Strong Sell by MarketsMOJO. This rating was last updated on 25 July 2025. However, the analysis and financial metrics discussed below reflect the stock’s current position as of 18 June 2026, providing investors with the latest insights into the company’s performance and outlook.
Read full news article
ARC Finance Ltd is Rated Strong Sell
ARC Finance Ltd is rated Strong Sell by MarketsMOJO, with this rating last updated on 25 July 2025. However, the analysis and financial metrics discussed here reflect the stock's current position as of 04 June 2026, providing investors with an up-to-date view of the company’s fundamentals, valuation, financial trends, and technical outlook.
Read full news article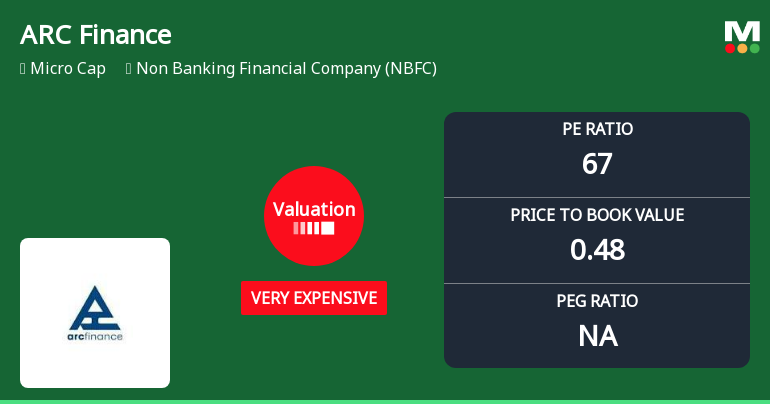
ARC Finance Ltd Valuation Shifts Signal Elevated Price Risk Amid Weak Returns
ARC Finance Ltd, a micro-cap player in the Non Banking Financial Company (NBFC) sector, has witnessed a marked deterioration in its valuation attractiveness as key price multiples surge to elevated levels. The company’s price-to-earnings (P/E) ratio now stands at 66.57, signalling a very expensive valuation compared to its historical and peer averages, while its price-to-book value (P/BV) remains subdued at 0.48. This article analyses the implications of these valuation shifts, contrasting ARC Finance’s metrics with sector peers and broader market benchmarks to provide investors with a comprehensive perspective.
Read full news article Announcements
Compliances-Reg.24(A)-Annual Secretarial Compliance
30-May-2026 | Source : BSEAnnual Secretarial Compliance Report under Regulation 24A for the financial year ended 31st March 2026.
Board Meeting Outcome for Outcome Of Board Meeting Of The Company For The Quarter And Year Ended 31St March 2026 Held On 29Th May 2026
29-May-2026 | Source : BSEPursuant to the provisions of Reg 30 of the Securities and Exchange Board of India (Listing Obligations and Disclosure Requirements) Regulations 2015 (SEBI Regulations) the Board of Directors of the Company at its Meeting held today i.e. 29th May 2026
Financial Result-31.03.2026
29-May-2026 | Source : BSEAudited financial result for the year ended 31.03.2026
Corporate Actions

No Upcoming Board Meetings

No Dividend history available

ARC Finance Ltd has announced 1:10 stock split, ex-date: 29 Mar 22

No Bonus history available

ARC Finance Ltd has announced 4:5 rights issue, ex-date: 10 Oct 24
Quality key factors
Valuation key factors
Technicals key factors
 Technical Indicator Scale: Bearish, Mildly Bearish, Sideways, Mildly Bullish, Bullish Turned
 Shareholding Snapshot : Mar 2026
Shareholding Compare (%holding)
Non Institution
None
Held by 0 Schemes
Held by 0 FIIs
Vaibhavlaxmi Vanijya Private Limited (6.88%)
Surabhi Dealmark Private Limited (2.29%)
85.34%
Quarterly Results Snapshot (Standalone) - Mar'26 - YoY

YoY Growth in quarter ended Mar 2026 is 482.19% vs -66.36% in Mar 2025
YoY Growth in quarter ended Mar 2026 is 113.87% vs -5,042.86% in Mar 2025
Half Yearly Results Snapshot (Standalone) - Sep'25

Growth in half year ended Sep 2025 is 0.00% vs 52.27% in Sep 2024
Growth in half year ended Sep 2025 is -95.96% vs 2,120.69% in Sep 2024
Nine Monthly Results Snapshot (Standalone) - Dec'25
YoY Growth in nine months ended Dec 2025 is 3.87% vs 98.90% in Dec 2024
YoY Growth in nine months ended Dec 2025 is -96.31% vs 3,290.00% in Dec 2024
Annual Results Snapshot (Standalone) - Mar'26
YoY Growth in year ended Mar 2026 is 141.73% vs -17.53% in Mar 2025
YoY Growth in year ended Mar 2026 is -78.25% vs 1,125.93% in Mar 2025
About ARC Finance Ltd

Company Coordinates


