
Compare Archean Chemical with Similar Stocks
Dashboard
Poor long term growth as Net Sales has grown by an annual rate of -9.14% and Operating profit at -36.33% over the last 5 years
The company has declared negative results for the last 9 consecutive quarters
With ROCE of 6.2, it has a Very Expensive valuation with a 3 Enterprise value to Capital Employed
Consistent Underperformance against the benchmark over the last 3 years
Stock DNA
Specialty Chemicals
INR 6,800 Cr (Small Cap)
63.00
46
0.46%
0.21
5.50%
3.47
Total Returns (Price + Dividend) 
Latest dividend: 2.5082260718087683 per share ex-dividend date: Jun-05-2026
Risk Adjusted Returns v/s
Returns Beta

News

Archean Chemical Industries Ltd Upgraded to Sell on Technical Improvement Despite Weak Fundamentals
Archean Chemical Industries Ltd has seen its investment rating upgraded from Strong Sell to Sell as of 15 July 2026, driven primarily by a shift in technical indicators despite ongoing challenges in financial performance and valuation metrics. This nuanced change reflects a cautious optimism in the stock’s near-term price action while acknowledging persistent fundamental weaknesses.
Read full news article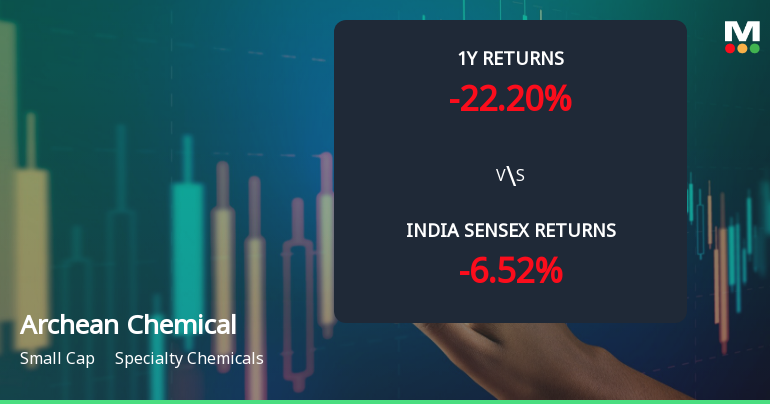
Archean Chemical Industries Ltd Sees Technical Momentum Shift Amid Mixed Market Signals
Archean Chemical Industries Ltd, a small-cap player in the Specialty Chemicals sector, has experienced a subtle shift in its technical momentum, moving from a bearish to a mildly bearish stance. Despite a modest day gain of 1.67%, the stock’s technical indicators present a complex picture, with some signals suggesting potential for recovery while others caution restraint. This analysis delves into the recent price action, key technical parameters, and comparative performance against the broader market.
Read full news article
Archean Chemical Industries Ltd is Rated Strong Sell
Archean Chemical Industries Ltd is rated Strong Sell by MarketsMOJO, with this rating last updated on 08 June 2026. However, the analysis and financial metrics discussed here reflect the stock’s current position as of 12 July 2026, providing investors with the most up-to-date perspective on the company’s performance and outlook.
Read full news article Announcements
Corporate Actions

No Upcoming Board Meetings

Archean Chemical Industries Ltd has declared 125% dividend, ex-date: 05 Jun 26

No Splits history available

No Bonus history available

No Rights history available
Quality key factors
Valuation key factors
Technicals key factors
 Technical Indicator Scale: Bearish, Mildly Bearish, Sideways, Mildly Bullish, Bullish Turned
 Shareholding Snapshot : Mar 2026
Shareholding Compare (%holding)
Promoters
21.9308
Held by 12 Schemes (17.11%)
Held by 77 FIIs (11.09%)
Chemikas Speciality Llp (30.53%)
Sbi Small Cap Fund (6.88%)
7.69%
Quarterly Results Snapshot (Consolidated) - Mar'26 - QoQ

QoQ Growth in quarter ended Mar 2026 is 18.22% vs 9.17% in Dec 2025

QoQ Growth in quarter ended Mar 2026 is -43.23% vs -18.73% in Dec 2025
Half Yearly Results Snapshot (Consolidated) - Sep'25
Growth in half year ended Sep 2025 is 15.97% vs -28.48% in Sep 2024
Growth in half year ended Sep 2025 is 14.25% vs -62.07% in Sep 2024
Nine Monthly Results Snapshot (Consolidated) - Dec'25
YoY Growth in nine months ended Dec 2025 is 12.17% vs -33.53% in Dec 2024
YoY Growth in nine months ended Dec 2025 is -14.45% vs -58.45% in Dec 2024
Annual Results Snapshot (Consolidated) - Mar'26
YoY Growth in year ended Mar 2026 is 3.85% vs -21.73% in Mar 2025
YoY Growth in year ended Mar 2026 is -34.10% vs -49.17% in Mar 2025
About Archean Chemical Industries Ltd

Company Coordinates


