
Compare Archean Chemical with Similar Stocks
Dashboard
Poor long term growth as Net Sales has grown by an annual rate of -9.14% and Operating profit at -36.33% over the last 5 years
The company has declared negative results for the last 9 consecutive quarters
With ROCE of 6.2, it has a Very Expensive valuation with a 2.9 Enterprise value to Capital Employed
Consistent Underperformance against the benchmark over the last 3 years
Stock DNA
Specialty Chemicals
INR 6,511 Cr (Small Cap)
61.00
45
0.47%
0.21
5.50%
3.39
Total Returns (Price + Dividend) 
Latest dividend: 2.5082260718087683 per share ex-dividend date: Jun-05-2026
Risk Adjusted Returns v/s
Returns Beta

News

Archean Chemical Industries Ltd is Rated Strong Sell
Archean Chemical Industries Ltd is rated Strong Sell by MarketsMOJO. This rating was last updated on 8 June 2026. However, the analysis and financial metrics presented here reflect the stock’s current position as of 20 June 2026, providing investors with the latest insights into the company’s performance and outlook.
Read full news article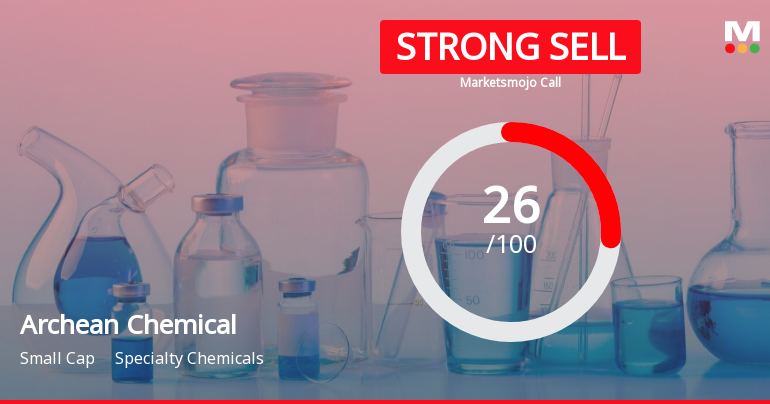
Archean Chemical Industries Ltd is Rated Strong Sell
Archean Chemical Industries Ltd is rated Strong Sell by MarketsMOJO. This rating was last updated on 08 June 2026. However, all fundamentals, returns, and financial metrics discussed below reflect the stock’s current position as of 09 June 2026, providing investors with the most up-to-date analysis.
Read full news article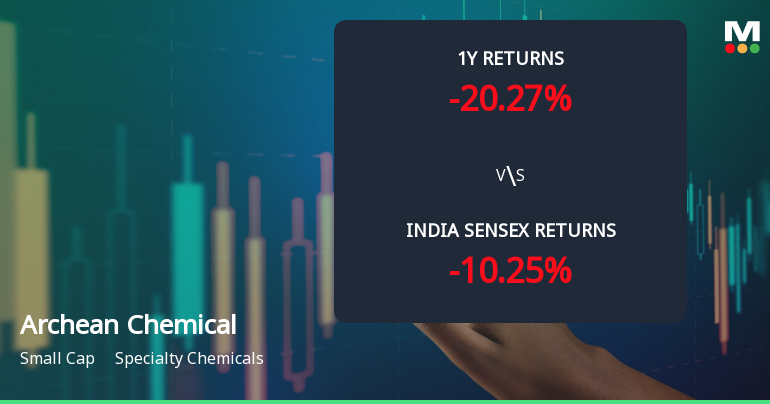
Archean Chemical Industries Ltd Faces Bearish Momentum Amid Technical Downturn
Archean Chemical Industries Ltd, a small-cap player in the Specialty Chemicals sector, has experienced a notable shift in technical momentum, with key indicators signalling a bearish trend. The stock’s recent downgrade from a Strong Sell to a Sell rating reflects deteriorating price momentum and technical weakness amid broader market pressures.
Read full news article Announcements
Closure of Trading Window
23-Jun-2026 | Source : BSEClosure of Trading Window
Disclosures under Reg. 29(1) of SEBI (SAST) Regulations 2011
13-Jun-2026 | Source : BSEThe Exchange has received the disclosure under Regulation 29(1) of SEBI (Substantial Acquisition of Shares & Takeovers) Regulations 2011 for CTL Trusteeship Ltd
Shareholder Meeting / Postal Ballot-Scrutinizers Report
12-Jun-2026 | Source : BSEVoting Results of 17th Annual General Meeting (AGM) of the Company along with Scrutinizers Report
Corporate Actions

No Upcoming Board Meetings

Archean Chemical Industries Ltd has declared 125% dividend, ex-date: 05 Jun 26

No Splits history available

No Bonus history available

No Rights history available
Quality key factors
Valuation key factors
Technicals key factors
 Technical Indicator Scale: Bearish, Mildly Bearish, Sideways, Mildly Bullish, Bullish Turned
 Shareholding Snapshot : Mar 2026
Shareholding Compare (%holding)
Promoters
21.9308
Held by 12 Schemes (17.11%)
Held by 77 FIIs (11.09%)
Chemikas Speciality Llp (30.53%)
Sbi Small Cap Fund (6.88%)
7.69%
Quarterly Results Snapshot (Consolidated) - Mar'26 - QoQ

QoQ Growth in quarter ended Mar 2026 is 18.22% vs 9.17% in Dec 2025

QoQ Growth in quarter ended Mar 2026 is -43.23% vs -18.73% in Dec 2025
Half Yearly Results Snapshot (Consolidated) - Sep'25
Growth in half year ended Sep 2025 is 15.97% vs -28.48% in Sep 2024
Growth in half year ended Sep 2025 is 14.25% vs -62.07% in Sep 2024
Nine Monthly Results Snapshot (Consolidated) - Dec'25
YoY Growth in nine months ended Dec 2025 is 12.17% vs -33.53% in Dec 2024
YoY Growth in nine months ended Dec 2025 is -14.45% vs -58.45% in Dec 2024
Annual Results Snapshot (Consolidated) - Mar'26
YoY Growth in year ended Mar 2026 is 3.85% vs -21.73% in Mar 2025
YoY Growth in year ended Mar 2026 is -34.10% vs -49.17% in Mar 2025
About Archean Chemical Industries Ltd

Company Coordinates


