Archidply Inds.

  • Market Cap: Micro Cap
  • Industry: Plywood Boards/ Laminates
  • ISIN: INE877I01016
  • NSEID: ARCHIDPLY
  • BSEID: 532994
INR
103.00
-2.29 (-2.17%)
BSENSE

Sep 01, 03:30 PM

BSE+NSE Vol: 21.0 k

  • Price Points
  • Score
  • Mojo Parameters
  • Total Return
  • News and Corporate Actions
  • Key factors
  • Shareholding
  • Financials
  • CompanyCV
stock-summaryPrice Point
High/Low

1Day

52 Week

Valuation
Technical
Day's Volume

CASH

21.0 k (-63.32%) Volume

Shareholding (Jun 2026)

FII

0.00%

Held by 0 FIIs

DII

0.00%

Held by 0 DIIs

Promoter

69.89%

Why is Archidply Industries Ltd falling/rising?

02-Sep-2026

As of 01-Sep, Archidply Industries Ltd's stock is declining by 2.17% after a total drop of 3.4% over the last two days, despite strong financial results. The decrease in investor participation and underperformance against its sector indicate reduced confidence in the stock.

As of 01-Sep, Archidply Industries Ltd's stock price is currently falling, with a change of -2.29, representing a decline of 2.17%. This downward movement follows a trend where the stock has been losing for the last two days, accumulating a total decline of 3.4% during this period. Despite opening the day with a gain of 9.6% and reaching an intraday high of Rs 115.4, the stock also experienced significant volatility, trading within a wide range of Rs 13.85, and touching a low of Rs 101.55, which reflects a drop of 3.55%.<BR><BR>Moreover, the stock has underperformed its sector by 1.46% today, and there has been a notable decrease in investor participation, with delivery volume falling by 92.09% compared to the five-day average. This decline in trading activity may indicate reduced investor confidence or interest in the stock at its current price levels. <BR><BR>While the company has reported strong financial results, including a 78.41% growth in net profit and positive results for the last four consecutive quarters, the recent price movements suggest that short-term market dynamics and investor sentiment are currently exerting downward pressure on the stock.

View full answer

Who are in the management team of Archidply Inds.?

01-Sep-2026

The management team of Archidply Industries includes Deen Dayal Daga (Executive Chairman), Rajiv Daga (Managing Director and CEO), Shyam D Daga (Non-Executive Director), and independent directors Mohammad Shahid Aftab, Shanti V Mallar, and Pritam Singh.

The management team of Archidply Industries includes the following members:<BR><BR>1. **Deen Dayal Daga** - Executive Chairman<BR>2. **Rajiv Daga** - Executive Director, Managing Director, Chief Executive Officer, and Promoter<BR>3. **Shyam D Daga** - Non-Executive Director<BR>4. **Mohammad Shahid Aftab** - Independent Non-Executive Director<BR>5. **Shanti V Mallar** - Independent Non-Executive Director<BR>6. **Pritam Singh** - Independent Non-Executive Director<BR><BR>If you need more information about their roles or the company, feel free to ask!

View full answer

What does Archidply Inds. do?

01-Sep-2026

Archidply Industries Ltd operates in the plywood and laminates industry, with a market cap of INR 211 Cr. As of June 2026, it reported net sales of 189 Cr and a net profit of 6 Cr.

Overview:<BR>Archidply Industries Ltd operates in the plywood boards and laminates industry and is categorized as a micro-cap company.<BR><BR>History:<BR>The company was incorporated on September 5, 1995, originally as ATP Silvi Products Limited. It did not engage in manufacturing activities until 2005. The latest quarterly results reported net sales and profit for June 2026.<BR><BR>Financial Snapshot:<BR>- Net Sales: 189 Cr (Quarterly Results - Jun 2026)<BR>- Net Profit: 6 Cr (Quarterly Results - Jun 2026)<BR>- Market cap: INR 211 Cr (Micro Cap)<BR><BR>Key Metrics:<BR>- P/E: 15.00<BR>- Industry P/E: 52<BR>- Dividend Yield: 0.00%<BR>- Debt Equity: 1.62<BR>- Return on Equity: 7.96%<BR>- Price to Book: 1.90<BR><BR>Contact Details:<BR>Address: Plot No 7 Sector-9 Integrted, Indl Estate SIDCUL Pant Nagar Udham Singh Nagar UTT : 263153<BR>Tel: 91-05944-250270/252269<BR>Email: info@archidply.com<BR>Website: http://www.archidply.com

View full answer

Who are the peers of the Archidply Inds.?

01-Sep-2026

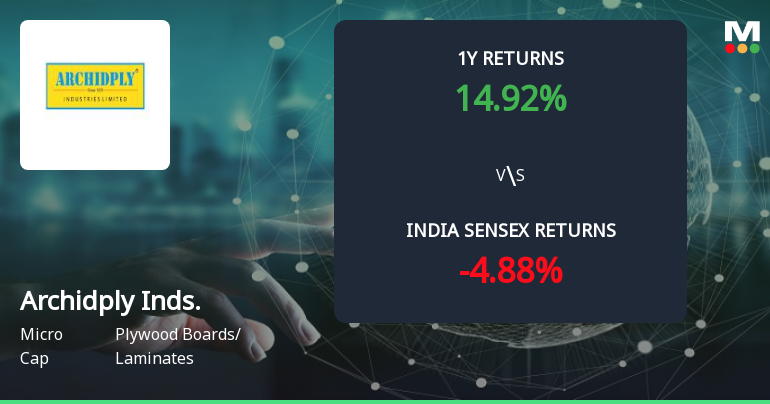
Peers of Archidply Inds. include Greenlam Industries, Stylam Industries, Greenply Industries, and others, with varying management and growth risks. Archidply Inds. has a 1-year return of 6.46%, higher than Greenpanel Inds. but lower than Stylam Industries, which leads with a 106.49% return.

Peers: The peers of Archidply Inds. are Greenlam Industr, Stylam Industrie, Greenply Industr, Greenpanel Inds., Rushil Decor, Ecoboard Inds., Duroply Indust., W I Plywoods, Airo Lam.<BR><BR>Quality Snapshot: Excellent management risk is observed at Stylam Industrie and Greenpanel Inds., while Good management risk is found at Greenlam Industr. Average management risk is present at Greenply Industr, Rushil Decor, and W I Plywoods, and the rest have Below Average management risk, including Archidply Inds., Ecoboard Inds., Duroply Indust., Airo Lam, and Sylvan Plyboard. Growth ratings show that Stylam Industrie has Average growth, while Greenlam Industr, Rushil Decor, Greenply Industr, Greenpanel Inds., and the rest have Below Average growth. Archidply Inds., Ecoboard Inds., Duroply Indust., Airo Lam, and Sylvan Plyboard also fall into the Below Average category for Capital Structure, while Stylam Industrie and Greenpanel Inds. have Excellent, and Greenlam Industr has Below Average.<BR><BR>Return Snapshot: Stylam Industrie has the highest 1-year return at 106.49%, while Greenpanel Inds. has the lowest at -41.67%. Archidply Inds. has a 1-year return of 6.46%, which is higher than Greenpanel Inds. but lower than Stylam Industrie. Additionally, Duroply Indust. and W I Plywoods have negative six-month returns.

View full answer

How big is Archidply Inds.?

01-Sep-2026

As of 31st August, Archidply Industries Ltd has a market capitalization of 211.00 Cr, with Net Sales of 711.86 Cr and a Net Profit of 13.03 Cr reported in the latest four quarters.

As of 31st August, Archidply Industries Ltd has a market capitalization of 211.00 Cr, categorizing it as a Micro Cap company.<BR><BR>In the latest four quarters, Archidply Industries Ltd reported Net Sales of 711.86 Cr and a Net Profit of 13.03 Cr.<BR><BR>The latest annual period for the balance sheet is March 2025, with Shareholder's Funds amounting to 103.91 Cr and Total Assets valued at 387.91 Cr.

View full answer

Should I buy, sell or hold Archidply Industries Ltd?

10-Aug-2026

Are Archidply Industries Ltd latest results good or bad?

09-May-2026

Archidply Industries Ltd's latest Q4 FY26 results are positive, showing a 95.65% increase in net profit and a 10.70% year-on-year growth in net sales, marking the highest quarterly revenue in seven quarters. However, challenges remain with low return on equity and high debt levels, indicating a cautious outlook.

Archidply Industries Ltd's latest results for Q4 FY26 can be considered quite positive. The company reported a net profit of ₹3.15 crores, which represents a remarkable 95.65% increase compared to the previous quarter. Additionally, net sales reached ₹179.13 crores, reflecting a 10.70% year-on-year growth and a 6.62% sequential improvement. This marks the highest quarterly revenue in at least seven quarters, indicating strengthening demand in the plywood and laminates segment.<BR><BR>The operating margin also improved to 6.63%, the best performance in seven quarters, showcasing effective cost management. Furthermore, the profit after tax (PAT) margin rose to 1.76%, a significant turnaround from a negative margin a year earlier.<BR><BR>However, while these results are encouraging, the company still faces structural challenges, including a low return on equity (ROE) of 3.50% and a return on capital employed (ROCE) of 6.55%, both of which are below industry averages. The high debt levels, with a debt-to-EBITDA ratio of 6.62 times, also constrain financial flexibility.<BR><BR>In summary, while Archidply's recent results demonstrate operational improvements and a return to profitability, the underlying financial metrics and challenges suggest a cautious outlook moving forward.

View full answer

When is the next results date for Archidply Industries Ltd?

30-Apr-2026

The next results date for Archidply Industries Ltd is 08 May 2026.

The next results date for Archidply Industries Ltd is scheduled for 08 May 2026.

View full answer

How has been the historical performance of Archidply Inds.?

02-Dec-2025

Archidply Inds. has seen significant revenue growth, with net sales increasing from 306.28 Cr in Mar'22 to 555.91 Cr in Mar'25, but profitability has declined, resulting in a negative profit before tax of -7.71 Cr and a profit after tax of -7.36 Cr in Mar'25. The company's total liabilities rose sharply to 387.91 Cr, and cash flow from operations was negative at -23.00 Cr, indicating ongoing financial challenges.

Answer:<BR>The historical performance of Archidply Inds. shows a significant increase in net sales over the past four years, rising from 306.28 Cr in Mar'22 to 555.91 Cr in Mar'25. However, despite this growth in sales, the company has faced challenges reflected in its profitability metrics. The operating profit (PBDIT) decreased from 26.32 Cr in Mar'23 to 23.42 Cr in Mar'25, while profit before tax turned negative at -7.71 Cr in Mar'25, down from 12.32 Cr in Mar'24. Consequently, the profit after tax also fell to -7.36 Cr in Mar'25, compared to 7.10 Cr in Mar'24. The company’s total liabilities increased significantly from 197.81 Cr in Mar'22 to 387.91 Cr in Mar'25, driven by a rise in both long-term and short-term borrowings. Cash flow from operating activities has been negative in Mar'25 at -23.00 Cr, indicating operational challenges, although cash flow from financing activities provided some support with an inflow of 27.00 Cr.<BR><BR>Breakdown:<BR>Archidply Inds. has experienced a robust increase in net sales, climbing from 306.28 Cr in Mar'22 to 555.91 Cr in Mar'25, indicating strong revenue growth. However, this growth has not translated into profitability, as evidenced by a decline in operating profit from 26.32 Cr in Mar'23 to 23.42 Cr in Mar'25, and a negative profit before tax of -7.71 Cr in Mar'25. The profit after tax also dropped to -7.36 Cr in the same period, reflecting ongoing financial difficulties. The company's total liabilities surged from 197.81 Cr in Mar'22 to 387.91 Cr in Mar'25, primarily due to increased borrowings. Additionally, cash flow from operating activities has been negative at -23.00 Cr in Mar'25, although financing activities provided a positive cash flow of 27.00 Cr, highlighting the company's reliance on external financing amidst operational challenges.

View full answer

Is Archidply Inds. overvalued or undervalued?

14-Nov-2025

As of November 13, 2025, Archidply Industries is considered very attractive and undervalued with a PE ratio of 140.24, despite its recent stock performance lagging behind the Sensex, indicating strong market potential compared to peers like Century Plyboard and Greenply Industries.

As of 13 November 2025, the valuation grade for Archidply Industries has moved from attractive to very attractive. The company is currently considered undervalued, with a PE ratio of 140.24, an EV to EBITDA of 11.30, and a PEG ratio of 1.02. In comparison to peers, Century Plyboard has a PE of 76.53 and Greenply Industries has a PE of 45.81, highlighting Archidply's relatively high valuation metrics but also its strong market position.<BR><BR>Despite its high PE ratio, Archidply's valuation is supported by its performance in the plywood and laminates industry, where it stands out against competitors. The company's recent stock performance has lagged behind the Sensex, with a year-to-date return of -14.44% compared to the Sensex's 8.11%, suggesting that the market may not fully recognize its potential. Overall, the combination of a very attractive valuation grade and the comparative analysis indicates that Archidply Industries is undervalued in its current market context.

View full answer

What is the technical trend for Archidply Inds.?

09-Jun-2025

As of May 9, 2025, Archidply Inds. shows a mildly bearish trend overall, with weekly indicators like MACD and KST suggesting some bullish strength, while monthly indicators remain predominantly bearish.

As of 9 May 2025, the technical trend for Archidply Inds. has changed from bearish to mildly bearish. The weekly MACD indicates a mildly bullish stance, while the monthly MACD shows a mildly bearish trend. The weekly RSI is bearish, and the daily moving averages are also mildly bearish. Bollinger Bands on the weekly chart are bullish, but the monthly perspective is mildly bearish. KST reflects a mildly bullish trend weekly and mildly bearish monthly. Overall, the indicators suggest a mildly bearish stance, with strength primarily from the weekly MACD and KST, despite some bullish signals from Bollinger Bands.

View full answer

Who are the top shareholders of the Archidply Inds.?

06-Jun-2025

The top shareholders of Archidply Industries are primarily promoters, with Vanraj Suppliers Pvt. Ltd holding 19.85%. Individual investors own 26.82%, while there are no holdings by mutual funds or foreign institutional investors, and no pledged promoter holdings.

The top shareholders of Archidply Industries are predominantly the promoters, with Vanraj Suppliers Pvt. Ltd holding the highest stake at 19.85%. Additionally, individual investors collectively own 26.82% of the company. There are currently no holdings by mutual funds or foreign institutional investors (FIIs), and there are no pledged promoter holdings.

View full answer

Has Archidply Inds. declared dividend?

06-Jun-2025

Yes, Archidply Industries Ltd has declared a 10% dividend, amounting to ₹1 per share, with an ex-date of August 25, 2009. However, the dividend yield is 0%, and while the stock has shown significant price growth over the years, the dividend has not contributed to returns.

Archidply Industries Ltd has declared a dividend.<BR><BR>Dividend Details:<BR>- Percentage announced: 10%<BR>- Amount per share: 1<BR>- Ex-date: 25 Aug 09<BR><BR>Dividend Yield: 0%<BR><BR>Total Returns by Period:<BR>In the 6-month period, the price return was -17.25%, the dividend return was 0%, resulting in a total return of -17.25%.<BR><BR>In the 1-year period, the price return was -6.73%, the dividend return was 0%, resulting in a total return of -6.73%.<BR><BR>In the 2-year period, the price return was 28.27%, the dividend return was 0%, resulting in a total return of 28.27%.<BR><BR>In the 3-year period, the price return was 81.57%, the dividend return was 0%, resulting in a total return of 81.57%.<BR><BR>In the 4-year period, the price return was 195.08%, the dividend return was 0%, resulting in a total return of 195.08%.<BR><BR>In the 5-year period, the price return was 348.06%, the dividend return was 0%, resulting in a total return of 348.06%.<BR><BR>Overall, Archidply Industries Ltd has declared a dividend, but the dividend yield remains at 0%, indicating that the dividend has not contributed to returns in recent periods. The total returns over the years show significant growth in price, particularly over longer periods, despite the lack of dividend contributions.

View full answer
iScoreScore
Click here to find our call on this stock
Strong Sell
Sell
Hold
Buy
Strong Buy

Dashboard

1

Weak Long Term Fundamental Strength with an average Return on Capital Employed (ROCE) of 7.57%

  • Low ability to service debt as the company has a high Debt to EBITDA ratio of 4.31 times
2

With a growth in Net Profit of 78.41%, the company declared Outstanding results in Jun 26

3

With ROCE of 9.9, it has a Attractive valuation with a 1.3 Enterprise value to Capital Employed

4

Majority shareholders : Promoters

 
5

Market Beating performance in long term as well as near term

stock-summaryMojo Parameters

Mojo Parameters

Loading Valuation Snapshot...

Stock DNA

stock-summary
Industry

Plywood Boards/ Laminates

stock-summary
Market cap

INR 209 Cr (Micro Cap)

stock-summary
P/E

15.00

stock-summary
Industry P/E

53

stock-summary
Dividend Yield

0.00%

stock-summary
Debt Equity

1.62

stock-summary
Return on Equity

7.96%

stock-summary
Price to Book

1.87

Revenue and Profits:
Net Sales:
189 Cr
(Quarterly Results - Jun 2026)
Net Profit:
6 Cr
stock-summaryTotal Returns
Total Returns (Price + Dividend) stock-summary
Dividend Yield (0%)
TimePeriod
Price Return
Dividend Return
Total Return
3 Months
33.66%
0%
33.66%
6 Months
26.96%
0%
26.96%
1 Year
4.09%
0%
4.09%
2 Years
-25.69%
0%
-25.69%
3 Years
50.65%
0%
50.65%
4 Years
2.9%
0%
2.9%
5 Years
239.37%
0%
239.37%

Latest dividend: 1 per share ex-dividend date: Aug-25-2009

Risk Adjusted Returns v/s stock-summary
Returns Beta
Icon
Beta has not been calculated since enough price history is not available
stock-summaryNews & Corporate Actions

News

Archidply Industries Gains 8.35%: 3 Key Factors Driving the Rally

Announcements stock-summary

Announcement under Regulation 30 (LODR)-Newspaper Publication

09-Aug-2026 | Source : BSE

Newspaper Publication

Results For Quarter Eneded 30 June 2026

07-Aug-2026 | Source : BSE

Results for the quarter ended 30 June 2026

Board Meeting Outcome for Outcome Of Board Meeting

07-Aug-2026 | Source : BSE

Outcome of Board Meeting

Corporate Actions stock-summary

stock-summary
BOARD MEETING

No Upcoming Board Meetings

stock-summary
DIVIDEND

Archidply Industries Ltd has declared 10% dividend, ex-date: 25 Aug 09

stock-summary
SPLITS

No Splits history available

stock-summary
BONUS

No Bonus history available

stock-summary
RIGHTS

No Rights history available

stock-summaryKey Factors

Quality key factors stock-summary

Factor
Value
Sales Growth (5y)
18.56%
EBIT Growth (5y)
21.03%
EBIT to Interest (avg)
1.80
Debt to EBITDA (avg)
6.36
Net Debt to Equity (avg)
1.62
Sales to Capital Employed (avg)
1.80
Tax Ratio
24.70%
Dividend Payout Ratio
0
Pledged Shares
0
Institutional Holding
0
ROCE (avg)
6.92%
ROE (avg)
6.53%

Valuation key factors

Factor
Value
P/E Ratio
15
Industry P/E
53
Price to Book Value
1.83
EV to EBIT
11.19
EV to EBITDA
8.11
EV to Capital Employed
1.32
EV to Sales
0.54
PEG Ratio
0.03
Dividend Yield
NA
ROCE (Latest)
9.87%
ROE (Latest)
7.96%

Technicals key factors

Indicator
Weekly
Monthly
MACD
Bullish
Mildly Bullish
RSI
Bearish
No Signal
Bollinger Bands
Mildly Bullish
Mildly Bullish
Moving Averages
Bullish (Daily)
KST
Bullish
Bearish
Dow Theory
No Trend
No Trend
OBV
No Trend
No Trend
stock-summary Technical Indicator Scale: Bearish, Mildly Bearish, Sideways, Mildly Bullish, Bullish  Turned 
stock-summaryShareholding
Shareholding Snapshot : Jun 2026stock-summary
Shareholding Compare (%holding) stock-summary
Majority shareholders

Promoters

Pledged Promoter Holdings

None

Mutual Funds

Held by 0 Schemes

FIIs

Held by 0 FIIs

Promoter with highest holding

Vanraj Suppliers Pvt. Ltd (19.85%)

Highest Public shareholder

None

Individual Investors Holdings

26.1%

stock-summaryFinancial
[
  {
    "link": "quarterly",
    "btn_text": "All Quarterly Results",
    "header": "Quarterly Results Snapshot (Consolidated) - Jun'26 - QoQ",
    "rhs": [
      {
        "prefix": "Net Sales ",
        "suffix": "QoQ Growth in quarter ended Jun 2026 is 5.52% vs 6.62% in Mar 2026",
        "dir": -1
      },
      {
        "prefix": "Consolidated Net Profit ",
        "suffix": "QoQ Growth in quarter ended Jun 2026 is 78.41% vs 95.65% in Mar 2026",
        "dir": -1
      }
    ],
    "table": {
      "header": [
        "Jun'26",
        "Mar'26",
        "Change(%)"
      ],
      "body": [
        {
          "field": "Net Sales",
          "val1": "189.01",
          "val2": "179.13",
          "chgp": "5.52%",
          "chgp_class": "positive"
        },
        {
          "field": "Operating Profit (PBDIT) excl Other Income",
          "val1": "13.93",
          "val2": "11.87",
          "chgp": "17.35%",
          "chgp_class": "positive"
        },
        {
          "field": "Interest",
          "val1": "3.92",
          "val2": "4.49",
          "chgp": "-12.69%",
          "chgp_class": "positive"
        },
        {
          "field": "Exceptional Items",
          "val1": "0.00",
          "val2": "0.00",
          "chgp": "",
          "chgp_class": "neutral"
        },
        {
          "field": "Consolidate Net Profit",
          "val1": "5.62",
          "val2": "3.15",
          "chgp": "78.41%",
          "chgp_class": "positive"
        },
        {
          "field": "Operating Profit Margin (Excl OI)",
          "val1": "7.37%",
          "val2": "6.63%",
          "chgp": "0.74%",
          "chgp_class": "positive"
        }
      ]
    }
  },
  {
    "link": "half-yearly",
    "btn_text": "All Half Yearly Results",
    "header": "Half Yearly Results Snapshot (Consolidated) - Sep'25",
    "rhs": [
      {
        "prefix": "Net Sales ",
        "suffix": " Growth in half year ended Sep 2025 is 32.96% vs 16.12% in Sep 2024",
        "dir": 1
      },
      {
        "prefix": "Consolidated Net Profit ",
        "suffix": " Growth in half year ended Sep 2025 is 158.55% vs -205.77% in Sep 2024",
        "dir": 1
      }
    ],
    "table": {
      "header": [
        "Sep'25",
        "Sep'24",
        "Change(%)"
      ],
      "body": [
        {
          "field": "Net Sales",
          "val1": "323.57",
          "val2": "243.35",
          "chgp": "32.96%",
          "chgp_class": "positive"
        },
        {
          "field": "Operating Profit (PBDIT) excl Other Income",
          "val1": "19.26",
          "val2": "7.37",
          "chgp": "161.33%",
          "chgp_class": "positive"
        },
        {
          "field": "Interest",
          "val1": "8.85",
          "val2": "8.12",
          "chgp": "8.99%",
          "chgp_class": "negative"
        },
        {
          "field": "Exceptional Items",
          "val1": "0.00",
          "val2": "0.00",
          "chgp": "",
          "chgp_class": "neutral"
        },
        {
          "field": "Consolidate Net Profit",
          "val1": "3.22",
          "val2": "-5.50",
          "chgp": "158.55%",
          "chgp_class": "positive"
        },
        {
          "field": "Operating Profit Margin (Excl OI)",
          "val1": "5.95%",
          "val2": "3.03%",
          "chgp": "2.92%",
          "chgp_class": "positive"
        }
      ]
    }
  },
  {
    "link": "nine-monthly",
    "btn_text": "All Nine Monthly Results",
    "header": "Nine Monthly Results Snapshot (Consolidated) - Dec'25",
    "rhs": [
      {
        "prefix": "Net Sales ",
        "suffix": "YoY Growth in nine months ended Dec 2025 is 24.73% vs 25.40% in Dec 2024",
        "dir": -1
      },
      {
        "prefix": "Consolidated Net Profit ",
        "suffix": "YoY Growth in nine months ended Dec 2025 is 166.62% vs -208.86% in Dec 2024",
        "dir": 1
      }
    ],
    "table": {
      "header": [
        "Dec'25",
        "Dec'24",
        "Change(%)"
      ],
      "body": [
        {
          "field": "Net Sales",
          "val1": "491.57",
          "val2": "394.11",
          "chgp": "24.73%",
          "chgp_class": "positive"
        },
        {
          "field": "Operating Profit (PBDIT) excl Other Income",
          "val1": "30.45",
          "val2": "13.06",
          "chgp": "133.15%",
          "chgp_class": "positive"
        },
        {
          "field": "Interest",
          "val1": "13.20",
          "val2": "12.81",
          "chgp": "3.04%",
          "chgp_class": "negative"
        },
        {
          "field": "Exceptional Items",
          "val1": "-1.39",
          "val2": "0.00",
          "chgp": "",
          "chgp_class": "neutral"
        },
        {
          "field": "Consolidate Net Profit",
          "val1": "4.83",
          "val2": "-7.25",
          "chgp": "166.62%",
          "chgp_class": "positive"
        },
        {
          "field": "Operating Profit Margin (Excl OI)",
          "val1": "6.19%",
          "val2": "3.31%",
          "chgp": "2.88%",
          "chgp_class": "positive"
        }
      ]
    }
  },
  {
    "link": "annual",
    "btn_text": "All Annual Results",
    "header": "Annual Results Snapshot (Consolidated) - Mar'26",
    "rhs": [
      {
        "prefix": "Net Sales ",
        "suffix": "YoY Growth in year ended Mar 2026 is 20.65% vs 27.60% in Mar 2025",
        "dir": -1
      },
      {
        "prefix": "Consolidated Net Profit ",
        "suffix": "YoY Growth in year ended Mar 2026 is 208.42% vs -203.66% in Mar 2025",
        "dir": 1
      }
    ],
    "table": {
      "header": [
        "Mar'26",
        "Mar'25",
        "Change(%)"
      ],
      "body": [
        {
          "field": "Net Sales",
          "val1": "670.70",
          "val2": "555.91",
          "chgp": "20.65%",
          "chgp_class": "positive"
        },
        {
          "field": "Operating Profit (PBDIT) excl Other Income",
          "val1": "42.32",
          "val2": "21.88",
          "chgp": "93.42%",
          "chgp_class": "positive"
        },
        {
          "field": "Interest",
          "val1": "17.69",
          "val2": "17.74",
          "chgp": "-0.28%",
          "chgp_class": "positive"
        },
        {
          "field": "Exceptional Items",
          "val1": "-1.39",
          "val2": "0.00",
          "chgp": "",
          "chgp_class": "neutral"
        },
        {
          "field": "Consolidate Net Profit",
          "val1": "7.98",
          "val2": "-7.36",
          "chgp": "208.42%",
          "chgp_class": "positive"
        },
        {
          "field": "Operating Profit Margin (Excl OI)",
          "val1": "6.31%",
          "val2": "3.94%",
          "chgp": "2.37%",
          "chgp_class": "positive"
        }
      ]
    }
  }
]

Quarterly Results Snapshot (Consolidated) - Jun'26 - QoQstock-summary

Jun'26
Mar'26
Change(%)
Net Sales
189.01
179.13
5.52%
Operating Profit (PBDIT) excl Other Income
13.93
11.87
17.35%
Interest
3.92
4.49
-12.69%
Exceptional Items
0.00
0.00
Consolidate Net Profit
5.62
3.15
78.41%
Operating Profit Margin (Excl OI)
7.37%
6.63%
0.74%
Values in Rs Cr.
Direction Arrows
Net Sales

QoQ Growth in quarter ended Jun 2026 is 5.52% vs 6.62% in Mar 2026

Direction Arrows
Consolidated Net Profit

QoQ Growth in quarter ended Jun 2026 is 78.41% vs 95.65% in Mar 2026

Half Yearly Results Snapshot (Consolidated) - Sep'25stock-summary

Sep'25
Sep'24
Change(%)
Net Sales
323.57
243.35
32.96%
Operating Profit (PBDIT) excl Other Income
19.26
7.37
161.33%
Interest
8.85
8.12
8.99%
Exceptional Items
0.00
0.00
Consolidate Net Profit
3.22
-5.50
158.55%
Operating Profit Margin (Excl OI)
5.95%
3.03%
2.92%
Values in Rs Cr.
Direction Arrows
Net Sales

Growth in half year ended Sep 2025 is 32.96% vs 16.12% in Sep 2024

Direction Arrows
Consolidated Net Profit

Growth in half year ended Sep 2025 is 158.55% vs -205.77% in Sep 2024

Nine Monthly Results Snapshot (Consolidated) - Dec'25stock-summary

Dec'25
Dec'24
Change(%)
Net Sales
491.57
394.11
24.73%
Operating Profit (PBDIT) excl Other Income
30.45
13.06
133.15%
Interest
13.20
12.81
3.04%
Exceptional Items
-1.39
0.00
Consolidate Net Profit
4.83
-7.25
166.62%
Operating Profit Margin (Excl OI)
6.19%
3.31%
2.88%
Values in Rs Cr.
Direction Arrows
Net Sales

YoY Growth in nine months ended Dec 2025 is 24.73% vs 25.40% in Dec 2024

Direction Arrows
Consolidated Net Profit

YoY Growth in nine months ended Dec 2025 is 166.62% vs -208.86% in Dec 2024

Annual Results Snapshot (Consolidated) - Mar'26stock-summary

Mar'26
Mar'25
Change(%)
Net Sales
670.70
555.91
20.65%
Operating Profit (PBDIT) excl Other Income
42.32
21.88
93.42%
Interest
17.69
17.74
-0.28%
Exceptional Items
-1.39
0.00
Consolidate Net Profit
7.98
-7.36
208.42%
Operating Profit Margin (Excl OI)
6.31%
3.94%
2.37%
Values in Rs Cr.
Direction Arrows
Net Sales

YoY Growth in year ended Mar 2026 is 20.65% vs 27.60% in Mar 2025

Direction Arrows
Consolidated Net Profit

YoY Growth in year ended Mar 2026 is 208.42% vs -203.66% in Mar 2025

stock-summaryCompany CV
About Archidply Industries Ltd stock-summary
stock-summary
Archidply Industries Ltd
Micro Cap
Plywood Boards/ Laminates
Archidply Industries Limited was incorporated on September 5, 1995 as ATP Silvi Products Limited. Until 2005, ATP Silvi did not carry any manufacturing activities. Mr Deen Dayal Daga, Mr Shyam D Daga, Mr Rajiv D Daga and Assam Timber Products Private Limited have promoted the Company. ATP Silvi was incorporated with the aim of raising tree & other plantations on wasteland.
Company Coordinates stock-summary
Company Details
Plot No 7 Sector-9 Integrted, Indl Estate SIDCUL Pant Nagar Udham Singh Nagar UTT : 263153
stock-summary
Tel: 91-05944-250270/252269
stock-summary
info@archidply.com
Registrar Details
Karvy Computershare Pvt Ltd, Plot No 17-24 , Near Image Hospital,, Reliance Cybervilae,Vithalrao Nagar,, Madhapur, Hyderabad