
Compare Archit Organosys with Similar Stocks
Dashboard
Weak Long Term Fundamental Strength with an average Return on Capital Employed (ROCE) of 9.96%
- Poor long term growth as Net Sales has grown by an annual rate of 8.32% and Operating profit at 7.07% over the last 5 years
The company has declared Positive results for the last 6 consecutive quarters
With ROCE of 10.5, it has a Attractive valuation with a 1.5 Enterprise value to Capital Employed
Majority shareholders : Promoters
Market Beating Performance
Stock DNA
Commodity Chemicals
INR 122 Cr (Micro Cap)
194.00
45
0.86%
0.30
10.53%
1.56
Total Returns (Price + Dividend) 
Latest dividend: 0.4954909819639279 per share ex-dividend date: Sep-22-2025
Risk Adjusted Returns v/s
Returns Beta

News
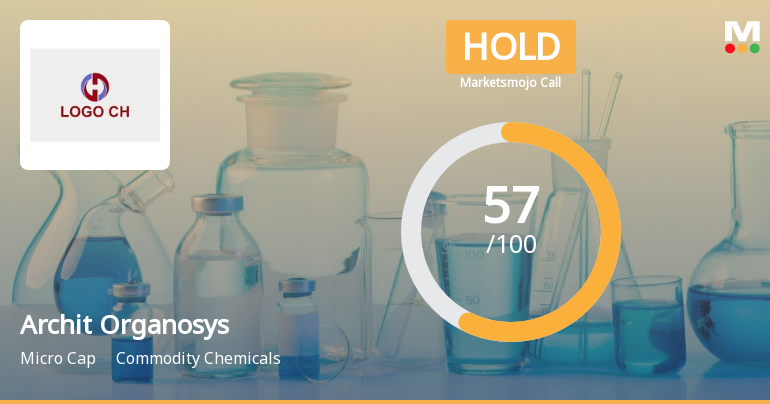
Archit Organosys Ltd is Rated Hold by MarketsMOJO
Archit Organosys Ltd is rated 'Hold' by MarketsMOJO, with this rating last updated on 17 April 2026. However, the analysis and financial metrics presented here reflect the stock's current position as of 27 June 2026, providing investors with an up-to-date view of the company’s performance and outlook.
Read full news article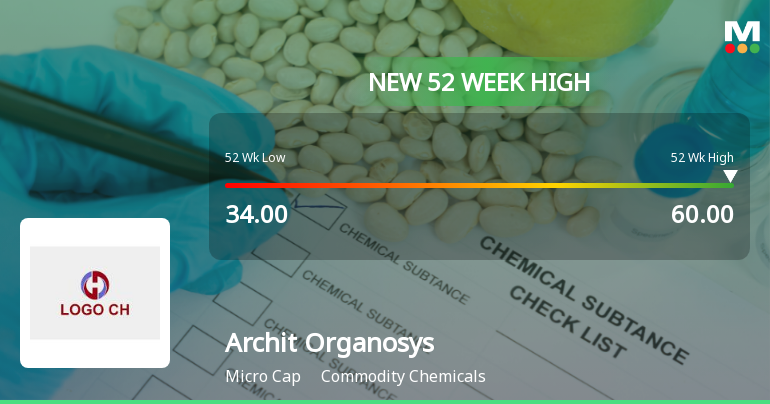
Broad-Based Technical Strength Lifts Archit Organosys Ltd to 52-Week High of Rs 60
With a decisive break above Rs 60 on 23 Jun 2026, Archit Organosys Ltd has reached a fresh 52-week high, extending its impressive 38.46% gain over the past year. This milestone comes amid a sustained rally supported by a confluence of bullish technical indicators and steady market momentum.
Read full news article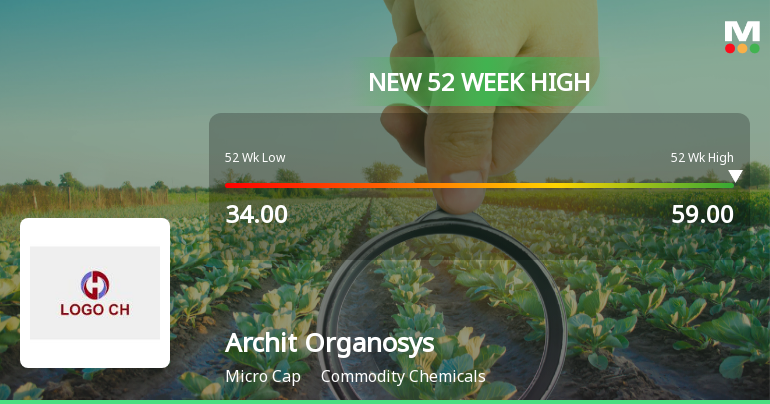
Broad-Based Technical Strength Lifts Archit Organosys Ltd to 52-Week High of Rs 59
With a decisive surge to Rs 59 on 22 Jun 2026, Archit Organosys Ltd has reached a fresh 52-week high, marking a 73.5% rise from its low of Rs 34 over the past year. This milestone reflects a strong alignment of technical indicators and sustained price momentum that has propelled the stock well ahead of the broader market's modest gains.
Read full news article Announcements
Closure of Trading Window
25-Jun-2026 | Source : BSEIntimation for Closure of Trading Window for the quarter ended 30th June 2026
Announcement under Regulation 30 (LODR)-Newspaper Publication
18-May-2026 | Source : BSENewspaper Publication regarding Notice of opening of Special Window for re-lodgement of transfer of shares.
Announcement under Regulation 30 (LODR)-Newspaper Publication
18-May-2026 | Source : BSENewspaper Publication regarding Audited Financial results for the Quarter and year ended on March 31 2026.
Corporate Actions

No Upcoming Board Meetings

Archit Organosys Ltd has declared 5% dividend, ex-date: 22 Sep 25

No Splits history available

No Bonus history available

Archit Organosys Ltd has announced 2:1 rights issue, ex-date: 09 Feb 17
Quality key factors
Valuation key factors
Technicals key factors
 Technical Indicator Scale: Bearish, Mildly Bearish, Sideways, Mildly Bullish, Bullish Turned
 Shareholding Snapshot : Mar 2026
Shareholding Compare (%holding)
Promoters
None
Held by 0 Schemes
Held by 0 FIIs
Archana Kandarp Amin (22.53%)
Shamoil Plumber (1.46%)
29.99%
Quarterly Results Snapshot (Standalone) - Mar'26 - QoQ

QoQ Growth in quarter ended Mar 2026 is -4.95% vs 16.86% in Dec 2025
QoQ Growth in quarter ended Mar 2026 is -16.87% vs 57.79% in Dec 2025
Half Yearly Results Snapshot (Standalone) - Sep'25

Growth in half year ended Sep 2025 is 16.84% vs -1.48% in Sep 2024
Growth in half year ended Sep 2025 is 77.23% vs 1.00% in Sep 2024
Nine Monthly Results Snapshot (Standalone) - Dec'25
YoY Growth in nine months ended Dec 2025 is 26.76% vs 0.26% in Dec 2024
YoY Growth in nine months ended Dec 2025 is 98.35% vs 96.75% in Dec 2024
Annual Results Snapshot (Standalone) - Mar'26
YoY Growth in year ended Mar 2026 is 12.22% vs 10.96% in Mar 2025
YoY Growth in year ended Mar 2026 is 59.01% vs 51.20% in Mar 2025
About Archit Organosys Ltd

Company Coordinates


