Arfin India

  • Market Cap: Micro Cap
  • Industry: Non - Ferrous Metals
  • ISIN: INE784R01023
  • NSEID: ARFIN
  • BSEID: 539151
INR
87.87
2.37 (2.77%)
BSENSE

Sep 02, 03:30 PM

BSE+NSE Vol: 10.32 lacs

  • Price Points
  • Score
  • Mojo Parameters
  • Total Return
  • News and Corporate Actions
  • Key factors
  • Shareholding
  • Financials
  • CompanyCV
stock-summaryPrice Point
High/Low

1Day

52 Week

Valuation
Technical
Day's Volume

CASH

10.32 lacs (5.67%) Volume

Shareholding (Jun 2026)

FII

0.79%

Held by 7 FIIs

DII

0.04%

Held by 0 DIIs

Promoter

69.77%

Why is Arfin India Ltd falling/rising?

02-Sep-2026

As of 01-Sep, Arfin India Ltd's stock price is Rs 85.75, down 1.82% today, but it has increased 155.66% over the past year, outperforming the broader market. The decline is seen as a short-term fluctuation amid strong long-term performance and rising investor interest.

As of 01-Sep, Arfin India Ltd's stock price is currently at Rs 85.75, reflecting a decrease of Rs 1.59 or 1.82%. This decline can be attributed to its performance today, where the stock underperformed its sector by 1.37% and reached an intraday low of Rs 85.17, marking a drop of 2.48%. <BR><BR>Despite this short-term decline, the stock has shown strong performance over the longer term, with a remarkable increase of 155.66% over the past year, significantly outpacing the broader market, which has only returned 2.32% during the same period. Additionally, the company has reported positive financial results over the last three consecutive quarters, with a substantial growth in profit after tax and net sales. <BR><BR>Investor participation has also risen, as indicated by a 161.67% increase in delivery volume compared to the 5-day average, suggesting that while the stock is currently experiencing a decline, there is still considerable interest and liquidity in trading the stock. Overall, the current price drop appears to be a short-term fluctuation against a backdrop of strong long-term performance and positive financial indicators.

View full answer

Which are the latest news on Arfin India?

02-Sep-2026

Who are in the management team of Arfin India?

01-Sep-2026

The management team of Arfin India includes Jatin Mahendrakumar Shah (Managing Director), Mahendrakumar Rikhavchand Shah (Executive Chairman), Pushpa Mahendra Shah (Executive Director), and several independent directors: Mukesh Kumar Chowdhary, Jitendra Shankerlal Shah, and Hardik Hundia, along with Saloni Ghanshyam Hurkat as Company Secretary & Compliance Officer.

The management team of Arfin India includes the following key members:<BR><BR>1. **Jatin Mahendrakumar Shah** - Managing Director<BR>2. **Mahendrakumar Rikhavchand Shah** - Executive Chairman<BR>3. **Pushpa Mahendra Shah** - Executive Director<BR>4. **Mukesh Kumar Chowdhary** - Independent Director<BR>5. **Jitendra Shankerlal Shah** - Independent Director<BR>6. **Hardik Hundia** - Independent Director<BR>7. **Saloni Ghanshyam Hurkat** - Company Secretary & Compliance Officer<BR><BR>These individuals play significant roles in guiding the company's operations and governance.

View full answer

What does Arfin India do?

01-Sep-2026

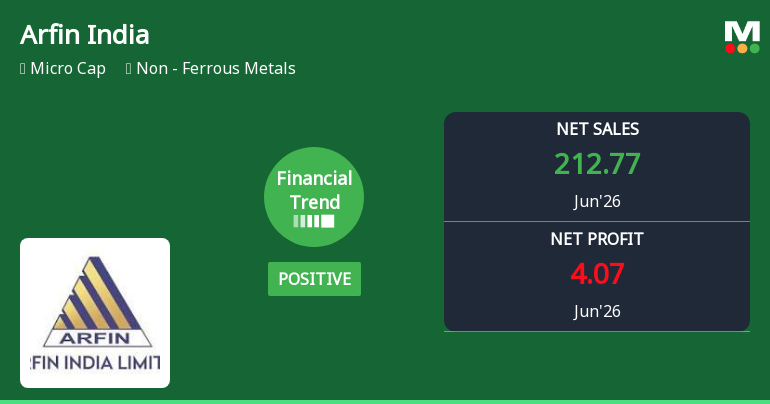
Arfin India Ltd manufactures and trades non-ferrous metal products, operating in the micro-cap segment of the industry. As of June 2026, it reported net sales of ₹213 Cr and a net profit of ₹4 Cr, with a market cap of ₹1,443 Cr.

Overview: <BR>Arfin India Ltd is engaged in the manufacturing, trading, and selling of various non-ferrous metal products and operates within the micro-cap segment of the Non-Ferrous Metals industry.<BR><BR>History: <BR>Arfin India Limited was incorporated on 10 April 1992 as a public limited company. The latest quarterly results reported net sales and net profit for the period ending June 2026.<BR><BR>Financial Snapshot: <BR>Net Sales: 213 Cr (Quarterly Results - Jun 2026) <BR>Net Profit: 4 Cr (Quarterly Results - Jun 2026) <BR>Market Cap: INR 1,443 Cr (Micro Cap)<BR><BR>Key Metrics: <BR>P/E: 81.00 <BR>Industry P/E: 31 <BR>Dividend Yield: 0.13% <BR>Debt-Equity: 0.71 <BR>Return on Equity: 9.06% <BR>Price to Book: 8.52 <BR><BR>Contact Details: <BR>Address: B 302 3rd Floor Pelican House, Nr Nataraj Cinema Ashram Road Ahmedabad Gujarat : 380009 <BR>Tel: 91-79-26583791/92 <BR>Email: investors@arfin.co.in <BR>Website: http://www.arfin.co.in

View full answer

Who are the peers of the Arfin India?

01-Sep-2026

Arfin India's peers include Dec.Gold Mines, Pondy Oxides, Bhagyanagar Ind, Onix Solar, Divine Power, MMP Industries, and Baheti Recycling. In terms of management risk, growth, and capital structure, Pondy Oxides stands out positively, while Arfin India shows average performance with a 1-year return of 165.47%.

Peers: The peers of Arfin India are Dec.Gold Mines, Pondy Oxides, Bhagyanagar Ind, Onix Solar, Divine Power, MMP Industries, and Baheti Recycling.<BR><BR>Quality Snapshot: Excellent management risk is observed at Pondy Oxides, while Average management risk is found at Onix Solar, Divine Power, MMP Industries, Baheti Recycling, and Arfin India. Below Average management risk is noted for Dec.Gold Mines and Bhagyanagar Ind. In terms of Growth, Excellent growth is seen at Pondy Oxides, Bhagyanagar Ind, and Divine Power, while Average growth is attributed to Arfin India, and Below Average growth is noted for Dec.Gold Mines, MMP Industries, and Baheti Recycling. For Capital Structure, Excellent capital structure is found at Onix Solar, Good capital structure is observed at Pondy Oxides and MMP Industries, while Below Average capital structure is noted for Dec.Gold Mines, Arfin India, Bhagyanagar Ind, Divine Power, and Baheti Recycling.<BR><BR>Return Snapshot: Bhagyanagar Ind has the highest 1-year return at 337.26%, while Divine Power has the lowest return at 0.00%. Arfin India's own 1-year return is 165.47%, which is significantly higher than Divine Power's but lower than Bhagyanagar Ind's. Additionally, Onix Solar, MMP Industries, and Baheti Recycling all have negative six-month returns.

View full answer

How big is Arfin India?

01-Sep-2026

As of 31st August, Arfin India Ltd has a market capitalization of 1,443.00 Cr, with recent net sales of 721.91 Cr and a net profit of 18.43 Cr. The company has shareholder's funds of 170.35 Cr and total assets of 371.40 Cr as of March 2026.

As of 31st August, Arfin India Ltd has a market capitalization of 1,443.00 Cr and is classified as a Micro Cap company.<BR><BR>In the latest four quarters, Arfin India reported Net Sales of 721.91 Cr and a Net Profit of 18.43 Cr.<BR><BR>For the latest annual period ending in March 2026, the company had Shareholder's Funds of 170.35 Cr and Total Assets amounting to 371.40 Cr.

View full answer

Should I buy, sell or hold Arfin India Ltd?

13-Aug-2026

Are Arfin India Ltd latest results good or bad?

11-Aug-2026

Arfin India Ltd's latest Q4 FY26 results are strong, with a net profit growth of 1,186.79% and a revenue increase of 26%. However, the stock's high P/E ratio of 107 suggests it may be overvalued despite the positive performance.

Arfin India Ltd's latest results for Q4 FY26 can be considered quite strong, showcasing significant improvements across key financial metrics. The company reported a net profit of ₹6.82 crores, which reflects an astonishing year-on-year growth of 1,186.79%. Revenue also saw a substantial increase, rising by 26.00% to ₹193.24 crores compared to the previous year.<BR><BR>Additionally, the operating margin improved to 8.45%, marking the highest level achieved in recent quarters, and the interest coverage ratio reached a record high of 4.16 times, indicating strong financial health and capacity to manage debt. This turnaround from a challenging previous year demonstrates operational improvements and a favorable market environment.<BR><BR>However, it's important to note that while the overall results are positive, the company is currently trading at a high valuation, with a P/E ratio of 107 times, which is significantly above the industry average. This suggests that while the operational performance is impressive, the stock may be viewed as expensive relative to its earnings potential.<BR><BR>In summary, the latest results indicate a strong performance for Arfin India Ltd, but potential investors should be cautious about the elevated valuations.

View full answer

When is the next results date for Arfin India Ltd?

07-Aug-2026

The next results date for Arfin India Ltd is 11 August 2026.

The next results date for Arfin India Ltd is scheduled for 11 August 2026.

View full answer

Is Arfin India technically bullish or bearish?

02-Dec-2025

As of December 1, 2025, the trend has shifted to bullish with strong indicators like a bullish MACD and daily moving averages, although the RSI shows some bearish signals, suggesting potential weakness.

As of 1 December 2025, the technical trend has changed from mildly bullish to bullish. The current stance is bullish with strong indicators supporting this view. The MACD is bullish on both the weekly and monthly time frames, and Bollinger Bands also indicate bullish momentum. Daily moving averages confirm a bullish trend. However, the RSI shows bearish signals on both weekly and monthly time frames, suggesting some potential weakness. Dow Theory indicates a mildly bullish stance on both weekly and monthly charts. Overall, the strength of the bullish trend is supported by the positive performance against the Sensex, particularly notable in the 1Y and 3Y returns.

View full answer

Has Arfin India declared dividend?

13-Nov-2025

Arfin India Ltd has declared an 11% dividend, with an ex-date of November 17, 2025. While the dividend yield is low, the company has demonstrated significant price returns over various periods, indicating strong overall performance.

Arfin India Ltd has declared an 11% dividend.<BR><BR>Dividend Details:<BR>- Percentage announced: 11%<BR>- Ex-date: 17 Nov 25<BR><BR>Dividend Yield: 0%<BR><BR>Total Returns by Period:<BR>In the last 3 months, the price return was 66.67%, the dividend return was 0.32%, resulting in a total return of 66.99%.<BR><BR>Over the past 6 months, the price return reached 119.17%, with a dividend return of 0.40%, culminating in a total return of 119.57%.<BR><BR>For the 1-year period, the price return was 67.44%, the dividend return was 0.32%, leading to a total return of 67.76%.<BR><BR>In the 2-year span, the price return stood at 40.82%, with a dividend return of 0.27%, resulting in a total return of 41.09%.<BR><BR>Over the last 3 years, the price return was 126.25%, the dividend return was 0.46%, yielding a total return of 126.71%.<BR><BR>In the 4-year period, the price return soared to 696.55%, with a dividend return of 1.69%, giving a total return of 698.24%.<BR><BR>Finally, in the 5-year timeframe, the price return was an impressive 1613.65%, with a dividend return of 1.86%, resulting in a total return of 1615.51%.<BR><BR>Overall, Arfin India Ltd has declared a dividend, and while the dividend yield remains low, the company has shown substantial price returns across various periods, indicating strong performance in terms of total returns.

View full answer

How has been the historical performance of Arfin India?

12-Nov-2025

Arfin India showed positive financial growth from March 2024 to March 2025, with net sales increasing to 615.75 Cr and profit after tax rising to 9.15 Cr. However, cash flow from operating activities declined to -21.00 Cr, despite improved financing activities.

Answer:<BR>The historical performance of Arfin India shows a positive trend in key financial metrics from March 2024 to March 2025.<BR><BR>Breakdown:<BR>In the fiscal year ending March 2025, Arfin India reported net sales of 615.75 Cr, an increase from 535.16 Cr in the previous year. Total operating income also rose to 615.75 Cr from 535.16 Cr. The raw material cost increased to 533.22 Cr from 448.69 Cr, while total expenditure (excluding depreciation) grew to 579.45 Cr from 504.95 Cr. Operating profit (PBDIT) improved to 38.26 Cr from 32.20 Cr, leading to a profit before tax of 14.38 Cr, up from 9.72 Cr. Profit after tax increased to 9.15 Cr from 8.22 Cr, resulting in an earnings per share (EPS) of 0.54 compared to 0.49. The company's total assets rose to 344.21 Cr from 285.29 Cr, with total liabilities increasing to 344.21 Cr from 285.29 Cr. Cash flow from operating activities showed a decline to -21.00 Cr from 4.00 Cr, while cash flow from financing activities improved significantly to 29.00 Cr from -8.00 Cr. Overall, Arfin India demonstrated growth in sales and profits, despite challenges in cash flow from operations.

View full answer

How has been the historical performance of Arfin India?

12-Nov-2025

Arfin India showed positive financial performance from March 2024 to March 2025, with net sales increasing from 535.16 Cr to 615.75 Cr and profit after tax rising from 8.22 Cr to 9.15 Cr, despite challenges in cash flow management. Total assets and liabilities both grew to 344.21 Cr, while operating profit improved from 32.20 Cr to 38.26 Cr.

Answer:<BR>The historical performance of Arfin India shows a positive trend in several key financial metrics from March 2024 to March 2025.<BR><BR>Breakdown:<BR>Arfin India's net sales increased from 535.16 Cr in March 2024 to 615.75 Cr in March 2025, reflecting a growth in total operating income, which also rose to 615.75 Cr from 535.16 Cr. The raw material cost increased significantly from 448.69 Cr to 533.22 Cr, while total expenditure (excluding depreciation) grew from 504.95 Cr to 579.45 Cr. Despite these rising costs, the operating profit (PBDIT) improved from 32.20 Cr to 38.26 Cr, indicating a stronger operational performance. Profit before tax increased from 9.72 Cr to 14.38 Cr, leading to a profit after tax rise from 8.22 Cr to 9.15 Cr. The earnings per share also saw an increase from 0.49 to 0.54. On the balance sheet, total assets grew from 285.29 Cr to 344.21 Cr, with total liabilities increasing from 285.29 Cr to 344.21 Cr as well. Cash flow from operating activities turned negative, dropping from 4.00 Cr to -21.00 Cr, while cash flow from financing activities improved significantly from -8.00 Cr to 29.00 Cr, resulting in a net cash inflow of 0.00 Cr compared to an outflow of -7.00 Cr the previous year. Overall, Arfin India demonstrated growth in sales and profitability, despite challenges in cash flow management.

View full answer

Is Arfin India overvalued or undervalued?

11-Sep-2025

As of September 10, 2025, Arfin India is overvalued with a PE ratio of 96.97 and high valuation metrics compared to peers, suggesting that investors may be overestimating its future growth potential.

As of 10 September 2025, Arfin India has moved from a fair to an expensive valuation grade. The company is currently overvalued, with a PE ratio of 96.97, a Price to Book Value of 4.43, and an EV to EBITDA ratio of 23.91. In comparison to its peers, Altius Telecom, which is rated very attractive, has a significantly lower PE ratio of 55.09, while Embassy Office REIT, rated very expensive, has a PE ratio of 23.51.<BR><BR>The high valuation metrics of Arfin India, particularly the PE ratio and the EV to EBITDA ratio, suggest that the market has priced the stock at a premium compared to its peers. Despite a strong stock performance relative to the Sensex over various time frames, the current valuation indicates that investors may be overestimating future growth potential.

View full answer

Who are the top shareholders of the Arfin India?

06-Jun-2025

The top shareholders of Arfin India include Mahendrakumar Rikhavchand Shah with 15.21%, Jfe Shoji India Private Limited at 5.81%, and individual investors collectively holding 20.38%. Foreign Institutional Investors hold 2.41%, and there are no mutual funds invested in the company.

The top shareholders of Arfin India include the promoters, who hold the majority of the shares. The promoter with the highest holding is Mahendrakumar Rikhavchand Shah, owning 15.21% of the company. Additionally, Jfe Shoji India Private Limited is the highest public shareholder, holding 5.81%. Foreign Institutional Investors (FIIs) have a stake of 2.41%, while individual investors collectively hold 20.38% of the shares. There are currently no mutual funds holding shares in the company.

View full answer

What is the bonus history of the Arfin India?

06-Jun-2025

Arfin India has issued bonuses twice, with a 1:5 bonus on November 13, 2018, and a 2:1 bonus on November 1, 2017, demonstrating the company's commitment to rewarding shareholders.

Arfin India has a history of bonus issues that includes two significant events. The latest bonus was a 1:5 bonus issue, which was announced with an ex-date of November 13, 2018, and the record date was November 14, 2018. Prior to that, the company issued a 2:1 bonus, with an ex-date of November 1, 2017, and a record date of November 2, 2017. This reflects Arfin India's approach to rewarding its shareholders through bonus shares.

View full answer
iScoreScore
Click here to find our call on this stock
Strong Sell
Sell
Hold
Buy
Strong Buy

Dashboard

1

Company's ability to service its debt is weak with a poor EBIT to Interest (avg) ratio of 1.94

  • Company's ability to service its debt is weak with a poor EBIT to Interest (avg) ratio of 1.94
  • The company has been able to generate a Return on Equity (avg) of 7.45% signifying low profitability per unit of shareholders funds
2

Poor long term growth as Net Sales has grown by an annual rate of 14.87% over the last 5 years

 
3

The company has declared Positive results for the last 3 consecutive quarters

4

With ROCE of 14.3, it has a Very Expensive valuation with a 5.4 Enterprise value to Capital Employed

5

Falling Participation by Institutional Investors

stock-summaryMojo Parameters

Mojo Parameters

Loading Valuation Snapshot...

Stock DNA

stock-summary
Industry

Non - Ferrous Metals

stock-summary
Market cap

INR 1,456 Cr (Micro Cap)

stock-summary
P/E

78.00

stock-summary
Industry P/E

31

stock-summary
Dividend Yield

0.13%

stock-summary
Debt Equity

0.71

stock-summary
Return on Equity

9.06%

stock-summary
Price to Book

8.45

Revenue and Profits:
Net Sales:
213 Cr
(Quarterly Results - Jun 2026)
Net Profit:
4 Cr
stock-summaryTotal Returns
Total Returns (Price + Dividend) stock-summary
Dividend Yield (0.13%)
TimePeriod
Price Return
Dividend Return
Total Return
3 Months
-3.28%
0%
-3.28%
6 Months
25.64%
0%
25.64%
1 Year
155.36%
0.28%
155.64%
2 Years
0%
0%
0.0%
3 Years
0%
0%
0.0%
4 Years
0%
0%
0.0%
5 Years
0%
0%
0.0%

Latest dividend: 0.11 per share ex-dividend date: Nov-17-2025

Risk Adjusted Returns v/s stock-summary
Returns Beta
Icon
Beta has not been calculated since enough price history is not available
stock-summaryNews & Corporate Actions

Announcements stock-summary

Icon
No announcement available

Corporate Actions stock-summary

stock-summary
BOARD MEETING

No Upcoming Board Meetings

stock-summary
DIVIDEND

Arfin India Ltd has declared 11% dividend, ex-date: 17 Nov 25

stock-summary
SPLITS

Arfin India Ltd has announced 1:10 stock split, ex-date: 14 Nov 22

stock-summary
BONUS

Arfin India Ltd has announced 1:5 bonus issue, ex-date: 13 Nov 18

stock-summary
RIGHTS

No Rights history available

stock-summaryKey Factors

Quality key factors stock-summary

Factor
Value
Sales Growth (5y)
14.87%
EBIT Growth (5y)
23.56%
EBIT to Interest (avg)
1.94
Debt to EBITDA (avg)
2.98
Net Debt to Equity (avg)
0.71
Sales to Capital Employed (avg)
2.10
Tax Ratio
31.40%
Dividend Payout Ratio
0
Pledged Shares
0
Institutional Holding
0.83%
ROCE (avg)
13.40%
ROE (avg)
7.45%

Valuation key factors

Factor
Value
P/E Ratio
78
Industry P/E
31
Price to Book Value
8.45
EV to EBIT
34.69
EV to EBITDA
31.37
EV to Capital Employed
5.37
EV to Sales
2.16
PEG Ratio
0.63
Dividend Yield
0.13%
ROCE (Latest)
14.29%
ROE (Latest)
9.06%

Technicals key factors

Indicator
Weekly
Monthly
MACD
Mildly Bearish
Bullish
RSI
No Signal
Bearish
Bollinger Bands
Mildly Bearish
Bullish
Moving Averages
Bullish (Daily)
KST
Mildly Bearish
Bullish
Dow Theory
Mildly Bullish
No Trend
OBV
Mildly Bearish
No Trend
stock-summary Technical Indicator Scale: Bearish, Mildly Bearish, Sideways, Mildly Bullish, Bullish  Turned 
stock-summaryShareholding
Shareholding Snapshot : Jun 2026stock-summary
Shareholding Compare (%holding) stock-summary
Majority shareholders

Promoters

Pledged Promoter Holdings

None

Mutual Funds

Held by 0 Schemes

FIIs

Held by 7 FIIs (0.79%)

Promoter with highest holding

Mahendrakumar Rikhavchand Shah (15.19%)

Highest Public shareholder

Jfe Shoji India Private Limited (5.81%)

Individual Investors Holdings

15.59%

stock-summaryFinancial
[
  {
    "link": "quarterly",
    "btn_text": "All Quarterly Results",
    "header": "Quarterly Results Snapshot (Consolidated) - Jun'26 - QoQ",
    "rhs": [
      {
        "prefix": "Net Sales ",
        "suffix": "QoQ Growth in quarter ended Jun 2026 is 10.11% vs 2.81% in Mar 2026",
        "dir": 1
      },
      {
        "prefix": "Consolidated Net Profit ",
        "suffix": "QoQ Growth in quarter ended Jun 2026 is -40.32% vs 33.99% in Mar 2026",
        "dir": -1
      }
    ],
    "table": {
      "header": [
        "Jun'26",
        "Mar'26",
        "Change(%)"
      ],
      "body": [
        {
          "field": "Net Sales",
          "val1": "212.77",
          "val2": "193.24",
          "chgp": "10.11%",
          "chgp_class": "positive"
        },
        {
          "field": "Operating Profit (PBDIT) excl Other Income",
          "val1": "10.15",
          "val2": "16.33",
          "chgp": "-37.84%",
          "chgp_class": "negative"
        },
        {
          "field": "Interest",
          "val1": "4.50",
          "val2": "3.93",
          "chgp": "14.50%",
          "chgp_class": "negative"
        },
        {
          "field": "Exceptional Items",
          "val1": "0.00",
          "val2": "0.00",
          "chgp": "",
          "chgp_class": "neutral"
        },
        {
          "field": "Consolidate Net Profit",
          "val1": "4.07",
          "val2": "6.82",
          "chgp": "-40.32%",
          "chgp_class": "negative"
        },
        {
          "field": "Operating Profit Margin (Excl OI)",
          "val1": "4.77%",
          "val2": "8.45%",
          "chgp": "-3.68%",
          "chgp_class": "negative"
        }
      ]
    }
  },
  {
    "link": "half-yearly",
    "btn_text": "All Half Yearly Results",
    "header": "Half Yearly Results Snapshot (Standalone) - Sep'25",
    "rhs": [
      {
        "prefix": "Net Sales ",
        "suffix": " Growth in half year ended Sep 2025 is -16.03% vs -0.32% in Sep 2024",
        "dir": -1
      },
      {
        "prefix": "Standalone Net Profit ",
        "suffix": " Growth in half year ended Sep 2025 is -36.56% vs 37.78% in Sep 2024",
        "dir": -1
      }
    ],
    "table": {
      "header": [
        "Sep'25",
        "Sep'24",
        "Change(%)"
      ],
      "body": [
        {
          "field": "Net Sales",
          "val1": "236.80",
          "val2": "282.01",
          "chgp": "-16.03%",
          "chgp_class": "negative"
        },
        {
          "field": "Operating Profit (PBDIT) excl Other Income",
          "val1": "15.95",
          "val2": "18.77",
          "chgp": "-15.02%",
          "chgp_class": "negative"
        },
        {
          "field": "Interest",
          "val1": "9.64",
          "val2": "9.64",
          "chgp": "",
          "chgp_class": "neutral"
        },
        {
          "field": "Exceptional Items",
          "val1": "0.00",
          "val2": "0.00",
          "chgp": "",
          "chgp_class": "neutral"
        },
        {
          "field": "Standalone Net Profit",
          "val1": "3.54",
          "val2": "5.58",
          "chgp": "-36.56%",
          "chgp_class": "negative"
        },
        {
          "field": "Operating Profit Margin (Excl OI)",
          "val1": "6.74%",
          "val2": "6.66%",
          "chgp": "0.08%",
          "chgp_class": "positive"
        }
      ]
    }
  },
  {
    "link": "nine-monthly",
    "btn_text": "All Nine Monthly Results",
    "header": "Nine Monthly Results Snapshot (Standalone) - Dec'25",
    "rhs": [
      {
        "prefix": "Net Sales ",
        "suffix": "YoY Growth in nine months ended Dec 2025 is -6.31% vs 16.07% in Dec 2024",
        "dir": -1
      },
      {
        "prefix": "Standalone Net Profit ",
        "suffix": "YoY Growth in nine months ended Dec 2025 is -2.90% vs 42.55% in Dec 2024",
        "dir": -1
      }
    ],
    "table": {
      "header": [
        "Dec'25",
        "Dec'24",
        "Change(%)"
      ],
      "body": [
        {
          "field": "Net Sales",
          "val1": "433.21",
          "val2": "462.38",
          "chgp": "-6.31%",
          "chgp_class": "negative"
        },
        {
          "field": "Operating Profit (PBDIT) excl Other Income",
          "val1": "29.49",
          "val2": "29.71",
          "chgp": "-0.74%",
          "chgp_class": "negative"
        },
        {
          "field": "Interest",
          "val1": "14.79",
          "val2": "15.20",
          "chgp": "-2.70%",
          "chgp_class": "positive"
        },
        {
          "field": "Exceptional Items",
          "val1": "0.00",
          "val2": "0.00",
          "chgp": "",
          "chgp_class": "neutral"
        },
        {
          "field": "Standalone Net Profit",
          "val1": "8.36",
          "val2": "8.61",
          "chgp": "-2.90%",
          "chgp_class": "negative"
        },
        {
          "field": "Operating Profit Margin (Excl OI)",
          "val1": "6.81%",
          "val2": "6.43%",
          "chgp": "0.38%",
          "chgp_class": "positive"
        }
      ]
    }
  },
  {
    "link": "annual",
    "btn_text": "All Annual Results",
    "header": "Annual Results Snapshot (Consolidated) - Mar'26",
    "rhs": [
      {
        "prefix": "Net Sales ",
        "suffix": "YoY Growth in year ended Mar 2026 is 0.36% vs 15.06% in Mar 2025",
        "dir": -1
      },
      {
        "prefix": "Consolidated Net Profit ",
        "suffix": "YoY Growth in year ended Mar 2026 is 68.85% vs 11.31% in Mar 2025",
        "dir": 1
      }
    ],
    "table": {
      "header": [
        "Mar'26",
        "Mar'25",
        "Change(%)"
      ],
      "body": [
        {
          "field": "Net Sales",
          "val1": "617.99",
          "val2": "615.75",
          "chgp": "0.36%",
          "chgp_class": "positive"
        },
        {
          "field": "Operating Profit (PBDIT) excl Other Income",
          "val1": "46.16",
          "val2": "36.30",
          "chgp": "27.16%",
          "chgp_class": "positive"
        },
        {
          "field": "Interest",
          "val1": "18.73",
          "val2": "19.82",
          "chgp": "-5.50%",
          "chgp_class": "positive"
        },
        {
          "field": "Exceptional Items",
          "val1": "0.00",
          "val2": "0.00",
          "chgp": "",
          "chgp_class": "neutral"
        },
        {
          "field": "Consolidate Net Profit",
          "val1": "15.45",
          "val2": "9.15",
          "chgp": "68.85%",
          "chgp_class": "positive"
        },
        {
          "field": "Operating Profit Margin (Excl OI)",
          "val1": "7.47%",
          "val2": "5.90%",
          "chgp": "1.57%",
          "chgp_class": "positive"
        }
      ]
    }
  }
]

Quarterly Results Snapshot (Consolidated) - Jun'26 - QoQstock-summary

Jun'26
Mar'26
Change(%)
Net Sales
212.77
193.24
10.11%
Operating Profit (PBDIT) excl Other Income
10.15
16.33
-37.84%
Interest
4.50
3.93
14.50%
Exceptional Items
0.00
0.00
Consolidate Net Profit
4.07
6.82
-40.32%
Operating Profit Margin (Excl OI)
4.77%
8.45%
-3.68%
Values in Rs Cr.
Direction Arrows
Net Sales

QoQ Growth in quarter ended Jun 2026 is 10.11% vs 2.81% in Mar 2026

Direction Arrows
Consolidated Net Profit

QoQ Growth in quarter ended Jun 2026 is -40.32% vs 33.99% in Mar 2026

Half Yearly Results Snapshot (Standalone) - Sep'25stock-summary

Sep'25
Sep'24
Change(%)
Net Sales
236.80
282.01
-16.03%
Operating Profit (PBDIT) excl Other Income
15.95
18.77
-15.02%
Interest
9.64
9.64
Exceptional Items
0.00
0.00
Standalone Net Profit
3.54
5.58
-36.56%
Operating Profit Margin (Excl OI)
6.74%
6.66%
0.08%
Values in Rs Cr.
Direction Arrows
Net Sales

Growth in half year ended Sep 2025 is -16.03% vs -0.32% in Sep 2024

Direction Arrows
Standalone Net Profit

Growth in half year ended Sep 2025 is -36.56% vs 37.78% in Sep 2024

Nine Monthly Results Snapshot (Standalone) - Dec'25stock-summary

Dec'25
Dec'24
Change(%)
Net Sales
433.21
462.38
-6.31%
Operating Profit (PBDIT) excl Other Income
29.49
29.71
-0.74%
Interest
14.79
15.20
-2.70%
Exceptional Items
0.00
0.00
Standalone Net Profit
8.36
8.61
-2.90%
Operating Profit Margin (Excl OI)
6.81%
6.43%
0.38%
Values in Rs Cr.
Direction Arrows
Net Sales

YoY Growth in nine months ended Dec 2025 is -6.31% vs 16.07% in Dec 2024

Direction Arrows
Standalone Net Profit

YoY Growth in nine months ended Dec 2025 is -2.90% vs 42.55% in Dec 2024

Annual Results Snapshot (Consolidated) - Mar'26stock-summary

Mar'26
Mar'25
Change(%)
Net Sales
617.99
615.75
0.36%
Operating Profit (PBDIT) excl Other Income
46.16
36.30
27.16%
Interest
18.73
19.82
-5.50%
Exceptional Items
0.00
0.00
Consolidate Net Profit
15.45
9.15
68.85%
Operating Profit Margin (Excl OI)
7.47%
5.90%
1.57%
Values in Rs Cr.
Direction Arrows
Net Sales

YoY Growth in year ended Mar 2026 is 0.36% vs 15.06% in Mar 2025

Direction Arrows
Consolidated Net Profit

YoY Growth in year ended Mar 2026 is 68.85% vs 11.31% in Mar 2025

stock-summaryCompany CV
About Arfin India Ltd stock-summary
stock-summary
Arfin India Ltd
Micro Cap
Non - Ferrous Metals
Arfin India Limited was incorporated on 10 April 1992 as a public limited Company. The company is engaged in the business of manufacturing, trading and selling of various non-ferrous metal products since its manufacturing activities are located at Chhatral, Dhanot and Vadaswami industrial areas in the State of Gujarat.
Company Coordinates stock-summary
Company Details
B 302 3rd Floor Pelican House, Nr Nataraj Cinema Ashram Road Ahmedabad Gujarat : 380009
stock-summary
Tel: 91-79-26583791/92
stock-summary
investors@arfin.co.in
Registrar Details
MCS Share Transfer Agent Ltd., Formerly MCS Ltd., 12/1/5, Monoharpukar Road, Kolkata