
Compare Aries Agro with Similar Stocks
Dashboard
Strong ability to service debt as the company has a low Debt to EBITDA ratio of 0.63 times
Poor long term growth as Net Sales has grown by an annual rate of 14.55% and Operating profit at 9.08% over the last 5 years
Flat results in Mar 26
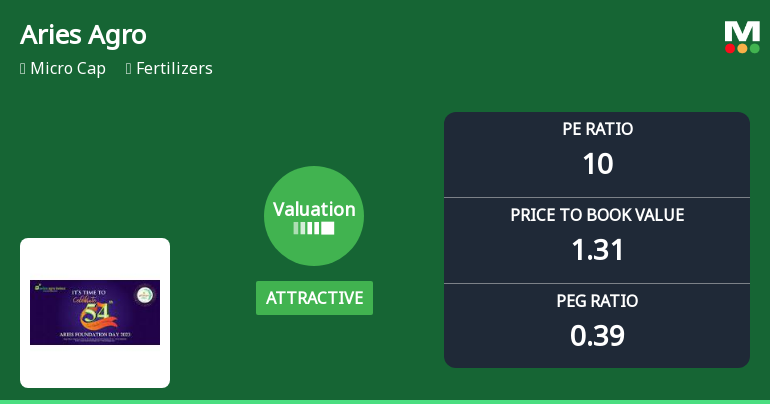
With ROE of 12.8, it has a Attractive valuation with a 1.3 Price to Book Value
Majority shareholders : Promoters
Consistent Returns over the last 3 years
Total Returns (Price + Dividend) 
Latest dividend: 1.2 per share ex-dividend date: Sep-19-2025
Risk Adjusted Returns v/s
Returns Beta

News
Aries Agro Ltd Valuation Shift Signals Renewed Price Attractiveness Amid Sector Dynamics
Aries Agro Ltd has witnessed a notable upgrade in its valuation parameters, shifting from very attractive to attractive, reflecting improved investor sentiment and robust financial metrics. The micro-cap fertilizer company’s price-to-earnings (P/E) ratio now stands at 10.24, signalling a more compelling entry point relative to its historical and peer averages.
Read full news article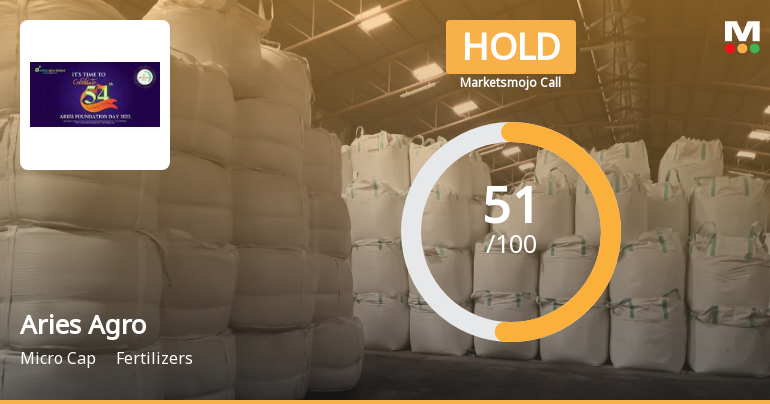
MarketsMOJO Upgrades Aries Agro Ltd to Hold on Improved Technicals and Valuation
Aries Agro Ltd, a micro-cap player in the fertilisers sector, has seen its investment rating upgraded from Sell to Hold as of 22 June 2026. This change reflects a nuanced improvement across multiple parameters including technical trends, valuation metrics, financial performance, and overall quality assessment. The company’s current Mojo Score stands at 51.0, signalling a cautious but positive outlook amid mixed market signals.
Read full news article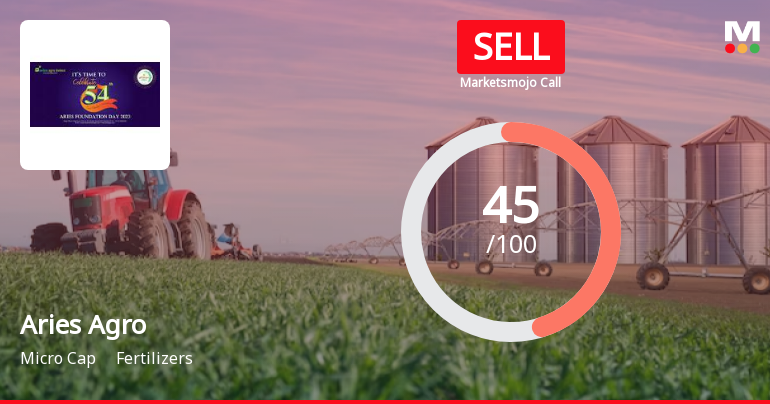
Aries Agro Ltd is Rated Sell by MarketsMOJO
Aries Agro Ltd is rated Sell by MarketsMOJO, with this rating last updated on 08 June 2026. However, the analysis and financial metrics discussed here reflect the stock’s current position as of 21 June 2026, providing investors with an up-to-date view of the company’s fundamentals, valuation, financial trends, and technical outlook.
Read full news article Announcements
Monthly Report On Special Window Re-Lodgement Of Shares- May 2026
08-Jun-2026 | Source : BSEMonthly Report on Special Window Re-Lodgement of Shares- May 2026
Announcement under Regulation 30 (LODR)-Press Release / Media Release
29-May-2026 | Source : BSEAries Agro Limited Press Release
Compliances-Reg.24(A)-Annual Secretarial Compliance
29-May-2026 | Source : BSEAnnual Secretarial Compliance Report of Aries Agro Limited for the year ended March 31 2026
Corporate Actions

No Upcoming Board Meetings

Aries Agro Ltd has declared 12% dividend, ex-date: 19 Sep 25

No Splits history available

No Bonus history available

No Rights history available
Quality key factors
Valuation key factors
Technicals key factors
 Technical Indicator Scale: Bearish, Mildly Bearish, Sideways, Mildly Bullish, Bullish Turned
 Shareholding Snapshot : Mar 2026
Shareholding Compare (%holding)
Promoters
None
Held by 0 Schemes
Held by 7 FIIs (3.25%)
Rahul Mirchandani (28.67%)
Acadian Emerging Markets Micro-cap Equity Master Fund (1.99%)
36.71%
Quarterly Results Snapshot (Consolidated) - Mar'26 - QoQ

QoQ Growth in quarter ended Mar 2026 is -8.74% vs -0.89% in Dec 2025
QoQ Growth in quarter ended Mar 2026 is -125.64% vs -13.84% in Dec 2025
Half Yearly Results Snapshot (Consolidated) - Sep'25
Growth in half year ended Sep 2025 is 11.07% vs 23.90% in Sep 2024
Growth in half year ended Sep 2025 is 14.93% vs 51.57% in Sep 2024
Nine Monthly Results Snapshot (Consolidated) - Dec'25
YoY Growth in nine months ended Dec 2025 is 13.73% vs 21.00% in Dec 2024
YoY Growth in nine months ended Dec 2025 is 25.35% vs 50.54% in Dec 2024
Annual Results Snapshot (Consolidated) - Mar'26
YoY Growth in year ended Mar 2026 is 20.05% vs 20.72% in Mar 2025
YoY Growth in year ended Mar 2026 is 25.96% vs 75.09% in Mar 2025
About Aries Agro Ltd

Company Coordinates


