
Compare Arihant Academy with Similar Stocks
Dashboard
High Management Efficiency with a high ROE of 24.52%
The company is Net-Debt Free
Healthy long term growth as Net Sales has grown by an annual rate of 35.10% and Operating profit at 47.77%
With a growth in Net Profit of 87.57%, the company declared Very Positive results in Mar 26
With ROE of 31.3, it has a Fair valuation with a 9.8 Price to Book Value
Stock DNA
Other Consumer Services
INR 285 Cr (Micro Cap)
31.00
179
0.21%
-0.46
31.33%
9.80
Total Returns (Price + Dividend) 
Latest dividend: 1 per share ex-dividend date: Sep-04-2025
Risk Adjusted Returns v/s
Returns Beta

News

Arihant Academy Ltd is Rated Hold
Arihant Academy Ltd is rated 'Hold' by MarketsMOJO, with this rating last updated on 16 June 2026. However, the analysis and financial metrics discussed here reflect the stock's current position as of 14 July 2026, providing investors with an up-to-date perspective on the company’s performance and outlook.
Read full news article
Arihant Academy Ltd is Rated Hold
Arihant Academy Ltd is rated 'Hold' by MarketsMOJO, with this rating last updated on 16 June 2026. While the rating was revised on that date, the analysis and financial metrics discussed here reflect the stock's current position as of 03 July 2026, providing investors with an up-to-date perspective on the company’s fundamentals, valuation, financial trends, and technical outlook.
Read full news article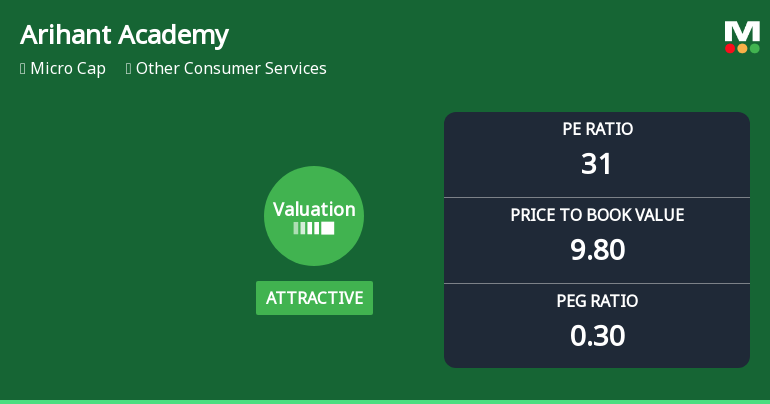
Arihant Academy Ltd Valuation Shifts Signal Renewed Price Attractiveness
Arihant Academy Ltd, a micro-cap player in the Other Consumer Services sector, has seen its valuation grade shift from fair to attractive, reflecting a notable change in market perception. Despite a modest day change of 0.21%, the company’s price-to-earnings (P/E) ratio, price-to-book value (P/BV), and other key financial metrics suggest a compelling investment case when compared to peers and historical benchmarks.
Read full news article Announcements
Corporate Actions

No Upcoming Board Meetings

Arihant Academy Ltd has declared 10% dividend, ex-date: 04 Sep 25

No Splits history available

No Bonus history available

No Rights history available
Quality key factors
Valuation key factors
Technicals key factors
 Technical Indicator Scale: Bearish, Mildly Bearish, Sideways, Mildly Bullish, Bullish Turned
 Shareholding Snapshot : Mar 2026
Shareholding Compare (%holding)
Promoters
None
Held by 0 Schemes
Held by 0 FIIs
Anil Suresh Kapasi (26.14%)
Shri Nilesh K Shah Huf (1.47%)
21.01%
Quarterly Results Snapshot (Standalone) - Mar'26 - QoQ

QoQ Growth in quarter ended Mar 2026 is 12.40% vs -12.32% in Dec 2025
QoQ Growth in quarter ended Mar 2026 is 87.57% vs -13.66% in Dec 2025
Half Yearly Results Snapshot (Consolidated) - Mar'26

Growth in half year ended Mar 2026 is -8.35% vs 72.80% in Sep 2025
Growth in half year ended Mar 2026 is 27.18% vs 88.26% in Sep 2025
Nine Monthly Results Snapshot (Standalone) - Dec'25
YoY Growth in nine months ended Dec 2025 is 46.27% vs 19.80% in Dec 2024
YoY Growth in nine months ended Dec 2025 is 65.62% vs 3,272.73% in Dec 2024
Annual Results Snapshot (Standalone) - Mar'26
YoY Growth in year ended Mar 2026 is 56.39% vs 33.77% in Mar 2025
YoY Growth in year ended Mar 2026 is 104.72% vs 187.10% in Mar 2025
About Arihant Academy Ltd

Company Coordinates


