
Compare Arih.Found.Hsg. with Similar Stocks
Dashboard
Poor Management Efficiency with a low ROCE of 9.40%
- The company has been able to generate a Return on Capital Employed (avg) of 9.40% signifying low profitability per unit of total capital (equity and debt)
Low ability to service debt as the company has a high Debt to EBITDA ratio of 4.73 times
Flat results in Mar 26
Despite the size of the company, domestic mutual funds hold only 0% of the company
Total Returns (Price + Dividend) 
Latest dividend: 1 per share ex-dividend date: Sep-20-2024
Risk Adjusted Returns v/s
Returns Beta

News

Arihant Foundations & Housing Ltd is Rated Sell
Arihant Foundations & Housing Ltd is rated 'Sell' by MarketsMOJO, with this rating last updated on 25 May 2026. However, the analysis and financial metrics discussed here reflect the company’s current position as of 09 June 2026, providing investors with an up-to-date view of the stock’s fundamentals, returns, and overall outlook.
Read full news articleAre Arihant Foundations & Housing Ltd latest results good or bad?
Arihant Foundations & Housing Ltd's latest financial results for Q4 FY26 reveal a complex picture characterized by significant revenue growth alongside a sharp decline in profitability. The company reported net sales of ₹147.61 crores, reflecting a substantial year-on-year increase of 118.88% and a quarter-on-quarter growth of 44.25%. This performance marks the strongest quarterly sales in at least two years, driven by project completions and handovers in its residential portfolio. However, the net profit for the same quarter fell to ₹4.29 crores, which represents a year-on-year decline of 62.60% and a quarter-on-quarter drop of 78.49%. This stark contrast between revenue growth and profitability raises concerns about the sustainability of the company's business model. The operating margin, excluding other income, contracted to 7.62%, the lowest level in eight quarters, indicating potential issues with cos...
Read full news article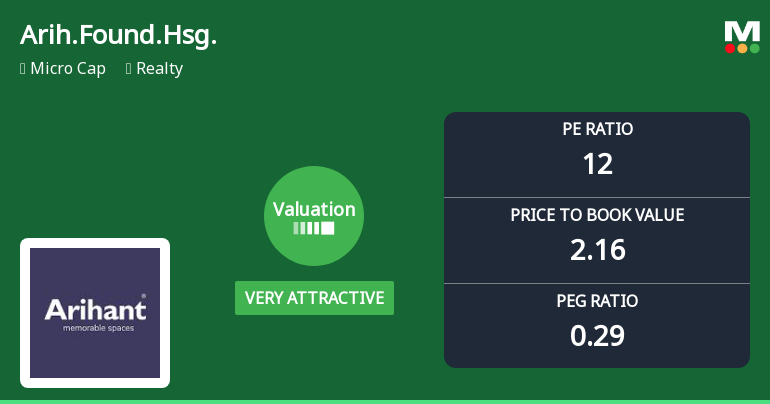
Arihant Foundations & Housing Ltd Valuation Turns Very Attractive Amid Market Downturn
Arihant Foundations & Housing Ltd has seen a significant shift in its valuation parameters, moving from a fair to a very attractive rating despite recent sharp declines in its share price. This change comes amid broader market volatility and a challenging realty sector, with the company’s price-to-earnings (P/E) and price-to-book value (P/BV) ratios now standing well below peer averages, signalling potential value for discerning investors.
Read full news article Announcements
Arihant Foundations & Housing Limited - Other General Purpose
22-Nov-2019 | Source : NSEArihant Foundations & Housing Limited has informed the Exchange regarding Disclosure of Related Party Transactions Pursuant to regulation 23(9) of SEBI(LODR) Regulation 2015 for the half year ended September 30, 2019.
Shareholders meeting
06-Sep-2019 | Source : NSE
| Arihant Foundations & Housing Limited has informed the Exchange regarding Notice of Annual General Meeting to be held on September 30, 2019 |
Press Release
06-Sep-2019 | Source : NSE
| Arihant Foundations & Housing Limited has informed the Exchange regarding a press release dated September 05, 2019, titled "Notice to Members". |
Corporate Actions

No Upcoming Board Meetings

Arihant Foundations & Housing Ltd has declared 10% dividend, ex-date: 20 Sep 24

No Splits history available

No Bonus history available

No Rights history available
Quality key factors
Valuation key factors
Technicals key factors
 Technical Indicator Scale: Bearish, Mildly Bearish, Sideways, Mildly Bullish, Bullish Turned
 Shareholding Snapshot : Mar 2026
Shareholding Compare (%holding)
Non Institution
None
Held by 0 Schemes
Held by 0 FIIs
Kamal Lunawath (14.63%)
Siddhartha Sacheti (6.92%)
32.54%
Quarterly Results Snapshot (Consolidated) - Mar'26 - YoY

YoY Growth in quarter ended Mar 2026 is 118.88% vs 48.38% in Mar 2025

YoY Growth in quarter ended Mar 2026 is -62.60% vs 1,174.44% in Mar 2025
Half Yearly Results Snapshot (Consolidated) - Sep'25
Growth in half year ended Sep 2025 is 95.86% vs 88.53% in Sep 2024
Growth in half year ended Sep 2025 is 58.30% vs 466.95% in Sep 2024
Nine Monthly Results Snapshot (Consolidated) - Dec'25
YoY Growth in nine months ended Dec 2025 is 96.19% vs 76.75% in Dec 2024
YoY Growth in nine months ended Dec 2025 is 65.52% vs 147.74% in Dec 2024
Annual Results Snapshot (Consolidated) - Mar'26
YoY Growth in year ended Mar 2026 is 103.60% vs 66.38% in Mar 2025
YoY Growth in year ended Mar 2026 is 38.10% vs 216.06% in Mar 2025
About Arihant Foundations & Housing Ltd

Company Coordinates


