
Compare Arisinfra Solu. with Similar Stocks
Dashboard
Healthy long term growth as Operating profit has grown by an annual rate 371.95%
With a growth in Net Sales of 26.78%, the company declared Very Positive results in Mar 26
With ROE of 7.4, it has a Very Attractive valuation with a 1.3 Price to Book Value
Increasing Participation by Institutional Investors
Stock DNA
Trading & Distributors
INR 974 Cr (Micro Cap)
18.00
23
0.00%
-0.07
7.42%
1.31
Total Returns (Price + Dividend) 
Arisinfra Solu. for the last several years.
Risk Adjusted Returns v/s
Returns Beta

News

Arisinfra Solutions Ltd is Rated Buy by MarketsMOJO
Arisinfra Solutions Ltd is rated Buy by MarketsMOJO, with this rating last updated on 15 Jun 2026. While the rating change occurred on that date, the analysis and financial metrics discussed here reflect the company’s current position as of 20 June 2026, providing investors with the latest insights into the stock’s fundamentals, valuation, financial trends, and technical outlook.
Read full news article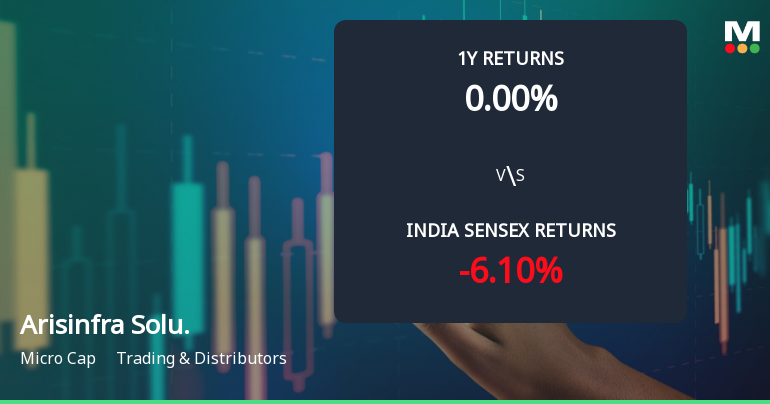
Arisinfra Solutions Ltd Technical Momentum Shifts Amid Mixed Market Signals
Arisinfra Solutions Ltd, a micro-cap player in the Trading & Distributors sector, has experienced a notable shift in its technical momentum, moving from a mildly bullish to a mildly bearish trend. Despite a recent downgrade in daily moving averages and a 3.66% drop in share price, the company’s weekly and monthly technical indicators present a nuanced picture, reflecting both resilience and caution for investors navigating volatile market conditions.
Read full news article
Arisinfra Solutions Ltd Sees Technical Momentum Shift Amid Mixed Returns
Arisinfra Solutions Ltd, a micro-cap player in the Trading & Distributors sector, has exhibited a notable shift in its technical momentum, moving from a mildly bearish stance to a mildly bullish outlook. This change is underscored by a 4.14% gain in the stock price on 16 Jun 2026, signalling renewed investor interest despite mixed returns over recent periods.
Read full news article Announcements
Corporate Actions

No Upcoming Board Meetings

No Dividend history available

No Splits history available

No Bonus history available

No Rights history available
Quality key factors
Valuation key factors
Technicals key factors
 Technical Indicator Scale: Bearish, Mildly Bearish, Sideways, Mildly Bullish, Bullish Turned
 Shareholding Snapshot : Mar 2026
Shareholding Compare (%holding)
Non Institution
None
Held by 0 Schemes
Held by 8 FIIs (2.08%)
Aspire Family Trust (jasmine Bhaskar Shah) (8.72%)
Neomile Growth Fund - Series I (5.72%)
36.97%
Quarterly Results Snapshot (Consolidated) - Mar'26 - QoQ

QoQ Growth in quarter ended Mar 2026 is 26.78% vs 12.29% in Dec 2025
QoQ Growth in quarter ended Mar 2026 is 29.84% vs 6.93% in Dec 2025
Half Yearly Results Snapshot (Standalone) - Sep'25
Not Applicable: The company has declared_date for only one period
Not Applicable: The company has declared_date for only one period
Nine Monthly Results Snapshot (Standalone) - Dec'25
Not Applicable: The company has declared_date for only one period
Not Applicable: The company has declared_date for only one period
Annual Results Snapshot (Consolidated) - Mar'26
YoY Growth in year ended Mar 2026 is 39.05% vs 10.16% in Mar 2025
YoY Growth in year ended Mar 2026 is 2,445.89% vs 111.12% in Mar 2025
About Arisinfra Solutions Ltd

Company Coordinates


