
Compare Aro Granite Inds with Similar Stocks
Dashboard
With a Operating Losses, the company has a Weak Long Term Fundamental Strength
- Low ability to service debt as the company has a high Debt to EBITDA ratio of 101.74 times
- The company has been able to generate a Return on Equity (avg) of 1.13% signifying low profitability per unit of shareholders funds
The company has declared negative results for the last 3 consecutive quarters
Risky - Negative Operating Profits
Consistent Underperformance against the benchmark over the last 3 years
Stock DNA
Diversified consumer products
INR 40 Cr (Micro Cap)
NA (Loss Making)
32
0.00%
0.80
-6.79%
0.23
Total Returns (Price + Dividend) 
Latest dividend: 1 per share ex-dividend date: Aug-23-2019
Risk Adjusted Returns v/s
Returns Beta

News
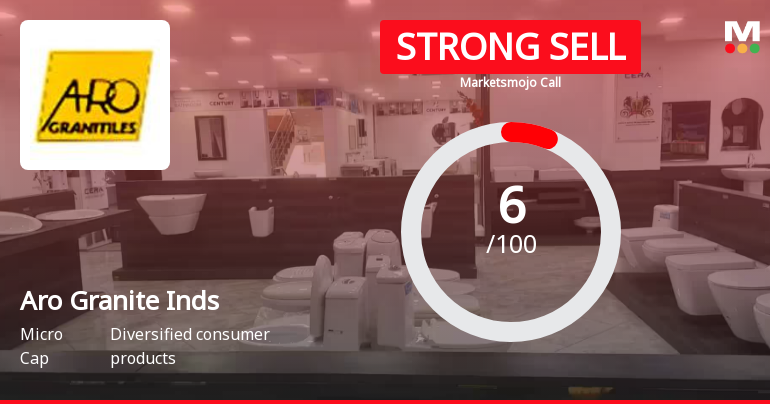
Aro Granite Industries Ltd is Rated Strong Sell
Aro Granite Industries Ltd is rated Strong Sell by MarketsMOJO, with this rating last updated on 21 May 2025. However, the analysis and financial metrics discussed here reflect the company’s current position as of 18 June 2026, providing investors with the latest insights into its performance and outlook.
Read full news article
Aro Granite Industries Ltd is Rated Strong Sell
Aro Granite Industries Ltd is rated Strong Sell by MarketsMOJO, with this rating last updated on 21 May 2025. However, the analysis and financial metrics presented here reflect the company’s current position as of 21 May 2026, providing investors with the latest insights into its performance and outlook.
Read full news articleAre Aro Granite Industries Ltd latest results good or bad?
Aro Granite Industries Ltd's latest financial results for Q4 FY26 reveal significant challenges across multiple key metrics. The company reported a net loss of ₹6.41 crores, marking a substantial decline compared to previous periods. Revenue for the quarter fell to ₹11.52 crores, representing a 57.03% decrease year-on-year and the lowest quarterly sales figure in the past seven quarters. This decline in revenue also reflects a sequential drop of 21.58% from the preceding quarter. The operating margin for the quarter was recorded at -24.22%, indicating a complete erosion of profitability, and this is the lowest level seen in seven quarters. The profit after tax (PAT) margin also deteriorated to -55.64%, highlighting the severe operational distress faced by the company. These results suggest that Aro Granite is grappling with fundamental weaknesses in its business model, particularly in its export-oriented o...
Read full news article Announcements
Compliances-Reg.24(A)-Annual Secretarial Compliance
22-May-2026 | Source : BSEAnnual Secretarial Compliance Report for the year ended March 31 2026.
Announcement under Regulation 30 (LODR)-Newspaper Publication
17-May-2026 | Source : BSENewspaper advertisement in respect of Published Financial Results for the Fourth quarter and Year ended March 31 2026
Re-Appointment Of Internal Auditor Of The Company
15-May-2026 | Source : BSEThe Company in its Board Meeting has approved the Re-Appointment of M/s. Sreekantha & Co. Chartered Accountants as the Internal Auditor of the Company for the Financial Year 2026-27.
Corporate Actions

No Upcoming Board Meetings

Aro Granite Industries Ltd has declared 10% dividend, ex-date: 23 Aug 19

No Splits history available

Aro Granite Industries Ltd has announced 1:2 bonus issue, ex-date: 30 Oct 13

No Rights history available
Quality key factors
Valuation key factors
Technicals key factors
 Technical Indicator Scale: Bearish, Mildly Bearish, Sideways, Mildly Bullish, Bullish Turned
 Shareholding Snapshot : Mar 2026
Shareholding Compare (%holding)
Non Institution
None
Held by 0 Schemes
Held by 0 FIIs
Sunil K Arora (31.94%)
Dilipkumar Lakhi (4%)
50.3%
Quarterly Results Snapshot (Standalone) - Mar'26 - QoQ

QoQ Growth in quarter ended Mar 2026 is -21.58% vs -27.53% in Dec 2025

QoQ Growth in quarter ended Mar 2026 is -115.82% vs -19.28% in Dec 2025
Half Yearly Results Snapshot (Standalone) - Sep'25
Growth in half year ended Sep 2025 is -28.49% vs -25.54% in Sep 2024
Growth in half year ended Sep 2025 is 62.11% vs -476.61% in Sep 2024
Nine Monthly Results Snapshot (Standalone) - Dec'25
YoY Growth in nine months ended Dec 2025 is -35.60% vs -21.21% in Dec 2024
YoY Growth in nine months ended Dec 2025 is 15.99% vs -459.78% in Dec 2024
Annual Results Snapshot (Standalone) - Mar'26
YoY Growth in year ended Mar 2026 is -40.27% vs -20.63% in Mar 2025
YoY Growth in year ended Mar 2026 is -84.11% vs -590.08% in Mar 2025
About Aro Granite Industries Ltd

Company Coordinates


