Aro Granite Inds

  • Market Cap: Micro Cap
  • Industry: Diversified consumer products
  • ISIN: INE210C01013
  • NSEID: AROGRANITE
  • BSEID: 513729
INR
24.20
-0.45 (-1.83%)
BSENSE

Sep 01, 03:30 PM

BSE+NSE Vol: 26.03 k

  • Price Points
  • Score
  • Mojo Parameters
  • Total Return
  • News and Corporate Actions
  • Key factors
  • Shareholding
  • Financials
  • CompanyCV
stock-summaryPrice Point
High/Low

1Day

52 Week

Valuation
Technical
Day's Volume

CASH

26.03 k (100.56%) Volume

Shareholding (Jun 2026)

FII

0.00%

Held by 0 FIIs

DII

0.00%

Held by 0 DIIs

Promoter

41.08%

Why is Aro Granite Industries Ltd falling/rising?

02-Sep-2026

As of 01-Sep, Aro Granite Industries Ltd's stock price is at 24.20, down 1.83%, reflecting significant underperformance with a year-to-date decline of 22.29%. The company faces serious financial issues, including consecutive operating losses and a high debt-to-EBITDA ratio, contributing to a lack of investor confidence.

As of 01-Sep, Aro Granite Industries Ltd's stock price is falling, currently at 24.20, reflecting a decrease of 0.45 or 1.83%. The stock has been underperforming significantly, with a consecutive decline over the last three days, resulting in a total drop of 4.35% during this period. This trend is further supported by the stock's performance against various benchmarks, showing a year-to-date decline of 22.29% compared to a 9.71% drop in the Sensex.<BR><BR>The company's financial health is concerning, as it has reported operating losses and negative results for the last four consecutive quarters. Specifically, net sales have decreased by 44.23%, and the profit after tax has fallen dramatically by 152.3%. Additionally, the company has a high debt-to-EBITDA ratio of 101.74 times, indicating a low ability to service its debt. The negative EBITDA of Rs. -6.77 crore further emphasizes the company's financial struggles.<BR><BR>Moreover, Aro Granite Industries Ltd has consistently underperformed against the benchmark indices over the past three years, with a staggering 65.43% decline over five years compared to a 34.19% increase in the benchmark. The stock is also trading below its moving averages across multiple time frames, which typically signals a bearish trend. Given these factors, the stock's decline is attributed to weak fundamentals, poor financial performance, and a lack of investor confidence.

View full answer

Who are in the management team of Aro Granite Inds?

01-Sep-2026

The management team of Aro Granite Industries includes Sunil K Arora (Managing Director), Dinesh Chandra Kothari, Vanita Sood, and G Sundareshwara (Independent Directors), Sujata Arora (Director), Sahil Arora (Whole-time Director), and Sabyasachi Panigrahi (Company Secretary & Compliance Officer).

The management team of Aro Granite Industries includes the following individuals:<BR><BR>1. **Sunil K Arora** - Managing Director<BR>2. **Dinesh Chandra Kothari** - Independent Director<BR>3. **Sujata Arora** - Director<BR>4. **Sabyasachi Panigrahi** - Company Secretary & Compliance Officer<BR>5. **Vanita Sood** - Independent Director<BR>6. **Sahil Arora** - Whole-time Director<BR>7. **G Sundareshwara** - Independent Director<BR><BR>If you need more specific information about any of the members or their roles, feel free to ask!

View full answer

What does Aro Granite Inds do?

01-Sep-2026

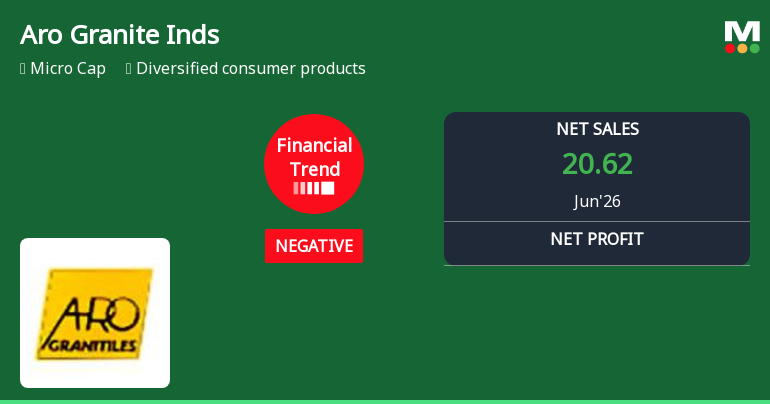
Aro Granite Industries Ltd is a manufacturer and exporter of granite slabs and tiles, incorporated in 1988. As of June 2026, it reported net sales of 21 Cr and a net loss of 7 Cr, with a market cap of INR 38 Cr.

Overview:<BR>Aro Granite Industries Ltd is a manufacturer and exporter of granite slabs and tiles, operating in the diversified consumer products industry within the micro-cap market.<BR><BR>History:<BR>Incorporated in 1988, Aro Granite Industries Ltd has been engaged in its manufacturing and exporting activities since its inception. The latest quarterly results reported are for June 2026, showing net sales and profit figures.<BR><BR>Financial Snapshot:<BR>- Net Sales: 21 Cr (Quarterly Results - Jun 2026)<BR>- Net Profit: -7 Cr (Quarterly Results - Jun 2026)<BR>- Market-cap: INR 38 Cr (Micro Cap)<BR><BR>Key Metrics:<BR>- P/E: N/A (Loss Making)<BR>- Industry P/E: 29<BR>- Dividend Yield: 0.00%<BR>- Debt Equity: 0.80<BR>- Return on Equity: -11.11%<BR>- Price to Book: 0.22<BR><BR>Contact Details:<BR>Address: 1001 10th Floor, DLF Tower A Jasola New Delhi New Delhi : 110025<BR>Tel: 91-11-41686169<BR>Email: investorsgrievance@arotile.com<BR>Website: http://www.arotile.com

View full answer

Who are the peers of the Aro Granite Inds?

01-Sep-2026

Aro Granite Inds' peers include Elegant Marbles, Archies, Royal Cush. Vin., and others, with varying management risks and growth rates. Medistep Health shows the highest 1-year return at 0.00%, while Aro Granite Inds has a return of -29.99%.

Peers: The peers of Aro Granite Inds are Elegant Marbles, Archies, Royal Cush. Vin., Oriental Trimex, Madhav Marbles, Pearl Polymers, Medistep Health., Ganga Bath Fitt., Lexus Granito, and A B M Internatl.<BR><BR>Quality Snapshot: Below Average management risk is observed at Elegant Marbles, Archies, Oriental Trimex, Madhav Marbles, Pearl Polymers, Lexus Granito, and A B M Internatl., while Average management risk is found at Ganga Bath Fitt. Good management risk is noted at Medistep Health. Growth is Excellent at Medistep Health and Average at Elegant Marbles and Oriental Trimex, while Below Average growth is seen at Archies, Royal Cush. Vin., Aro Granite Inds, Madhav Marbles, Pearl Polymers, and Lexus Granito. Capital Structure is Good at Elegant Marbles and Medistep Health, Average at Ganga Bath Fitt., and Below Average at Archies, Royal Cush. Vin., Aro Granite Inds, Oriental Trimex, Madhav Marbles, Pearl Polymers, Lexus Granito, and A B M Internatl.<BR><BR>Return Snapshot: The peer with the highest 1-year return is Medistep Health. at 0.00%, while the peer with the lowest is Pearl Polymers at -50.95%. Aro Granite Inds has a 1-year return of -29.99%, which is higher than Pearl Polymers but lower than Medistep Health. Additionally, several peers, including Archies, Oriental Trimex, and Pearl Polymers, have negative six-month returns.

View full answer

How big is Aro Granite Inds?

01-Sep-2026

As of 31st August, Aro Granite Industries Ltd has a market capitalization of 38.00 Cr and reported net sales of 67.10 Cr with a net loss of 19.32 Cr over the latest four quarters. Shareholder's funds are valued at 173.94 Cr, and total assets amount to 394.26 Cr as of March 2026.

As of 31st August, Aro Granite Industries Ltd has a market capitalization of 38.00 Cr, categorizing it as a Micro Cap company.<BR><BR>In the latest four quarters, Aro Granite reported net sales of 67.10 Cr. However, the company experienced a net loss of 19.32 Cr during the same period.<BR><BR>The latest reporting period for the balance sheet is March 2026. Shareholder's funds are valued at 173.94 Cr, while total assets amount to 394.26 Cr.

View full answer

Should I buy, sell or hold Aro Granite Industries Ltd?

08-Aug-2026

When is the next results date for Aro Granite Industries Ltd?

31-Jul-2026

The next results date for Aro Granite Industries Ltd is August 7, 2026.

The next results date for Aro Granite Industries Ltd is scheduled for August 7, 2026.

View full answer

Are Aro Granite Industries Ltd latest results good or bad?

16-May-2026

Aro Granite Industries Ltd's latest Q4 FY26 results are concerning, showing a net loss of ₹6.41 crore and a 57.03% drop in revenue, marking the lowest sales in seven quarters. The company's deteriorating operating margin and negative profit after tax indicate significant financial distress and a need for strategic intervention.

Aro Granite Industries Ltd's latest results for Q4 FY26 are quite concerning. The company reported a net loss of ₹6.41 crore, which is a staggering decline of 32,050% year-on-year. Revenue also fell sharply by 57.03% compared to the same quarter last year, amounting to just ₹11.52 crore, marking the lowest quarterly sales in the past seven quarters. <BR><BR>The operating margin has deteriorated significantly, now at -24.22%, indicating that the company is incurring losses on every rupee of sales before accounting for interest and depreciation. Additionally, the profit after tax (PAT) margin stands at -55.64%, reflecting severe financial distress.<BR><BR>Overall, these results highlight a critical situation for Aro Granite, with collapsing revenues and mounting losses suggesting that immediate strategic intervention is necessary to address the underlying issues. The financial performance indicates a trend of declining operational efficiency and significant challenges in the market.

View full answer

How has been the historical performance of Aro Granite Inds?

13-Nov-2025

Aro Granite Inds has shown a declining trend in net sales and profitability, with net sales dropping from 163.90 Cr in March 2023 to 123.09 Cr in March 2025, and profit after tax turning negative at -6.42 Cr in March 2025. Total assets and liabilities also decreased during this period, while cash flow from operating activities remained positive but lower than the previous year.

Answer:<BR>The historical performance of Aro Granite Inds shows a declining trend in net sales and profitability over the past few years.<BR><BR>Breakdown:<BR>Aro Granite Inds reported net sales of 123.09 Cr for the year ending March 2025, a decrease from 155.09 Cr in March 2024 and 163.90 Cr in March 2023, indicating a consistent decline from a peak of 224.74 Cr in March 2022. Total operating income followed a similar trend, dropping to 123.09 Cr in March 2025 from 155.09 Cr in the previous year. The company's total expenditure also decreased to 116.79 Cr in March 2025 from 124.24 Cr in March 2024, reflecting a reduction in raw material costs and other expenses. Operating profit (PBDIT) fell significantly to 15.96 Cr in March 2025 from 31.23 Cr in March 2024, leading to a profit before tax of -6.85 Cr in March 2025, compared to a profit of 3.40 Cr in March 2024. Consequently, profit after tax also turned negative at -6.42 Cr in March 2025, down from 1.31 Cr in March 2024. The company's total liabilities decreased to 419.74 Cr in March 2025 from 444.59 Cr in March 2024, while total assets also declined to 419.74 Cr in March 2025 from 444.59 Cr in March 2024. Cash flow from operating activities remained positive at 33.00 Cr in March 2025, although it was lower than 35.00 Cr in March 2024. Overall, Aro Granite Inds has experienced a downward trend in sales and profitability, alongside a reduction in both assets and liabilities.

View full answer

Who are the top shareholders of the Aro Granite Inds?

17-Jul-2025

The top shareholder of Aro Granite Industries is Sunil K Arora, holding 31.94%, followed by public shareholder Dilipkumar Lakhi at 4%. Individual investors own 50.12% of the company, with no institutional or pledged promoter holdings.

The top shareholders of Aro Granite Industries include Sunil K Arora, who holds the largest stake at 31.94%. The highest public shareholder is Dilipkumar Lakhi, with a holding of 4%. Additionally, individual investors collectively own 50.12% of the company. Notably, there are no institutional holdings from mutual funds or foreign institutional investors, and there are no pledged promoter holdings.

View full answer

Is Aro Granite Inds overvalued or undervalued?

09-Jun-2025

As of May 19, 2025, Aro Granite Industries is considered risky and overvalued, with a PE ratio of -9.09 and an EV to EBITDA of 33.21, significantly underperforming compared to peers like L T Foods and Cera Sanitary, and showing a year-to-date return of -14.59% against the Sensex's 5.61%.

As of 19 May 2025, the valuation grade for Aro Granite Industries has moved from very attractive to risky. This shift indicates that the company is currently overvalued. Key ratios highlight the concerning financial situation, with a PE ratio of -9.09, an EV to EBITDA of 33.21, and a Price to Book Value of 0.31, all suggesting significant challenges in profitability and valuation.<BR><BR>In comparison to its peers, Aro Granite's valuation metrics are starkly unfavorable. For instance, L T Foods, which is rated very attractive, has a PE ratio of 27.31 and an EV to EBITDA of 18.04, while Cera Sanitary, rated attractive, has a PE of 34.68 and an EV to EBITDA of 26.52. Additionally, Aro Granite's recent stock performance has lagged behind the Sensex, with a year-to-date return of -14.59% compared to the Sensex's 5.61%, further reinforcing the notion that the company is overvalued in its current state.

View full answer

What is the technical trend for Aro Granite Inds?

09-Jun-2025

As of May 21, 2025, Aro Granite Inds shows a mildly bearish trend overall, with conflicting signals across timeframes, as weekly indicators suggest mild bullishness while daily moving averages indicate short-term weakness.

As of 21 May 2025, the technical trend for Aro Granite Inds has changed from bearish to mildly bearish. The weekly MACD and Bollinger Bands indicate a mildly bullish stance, while the monthly indicators show bearish signals. The daily moving averages are mildly bearish, suggesting short-term weakness. The KST is mildly bullish on the weekly timeframe but bearish monthly, and the OBV reflects a mildly bullish trend weekly but mildly bearish monthly. Overall, the current technical stance is mildly bearish, driven primarily by the conflicting signals across different timeframes and the daily moving averages.

View full answer

What is the bonus history of the Aro Granite Inds?

06-Jun-2025

Aro Granite Industries has issued bonuses twice, both at a ratio of 1:2: the most recent on October 30, 2013, and another on September 26, 2008.

Aro Granite Industries has a history of bonus issues, with two notable instances. The most recent bonus was a 1:2 issue announced with an ex-date of October 30, 2013, and the record date was October 31, 2013. Prior to that, the company issued another 1:2 bonus on September 30, 2008, with an ex-date of September 26, 2008. This indicates a pattern of issuing bonuses at a ratio of 1:2 in both cases.

View full answer

Has Aro Granite Inds declared dividend?

06-Jun-2025

Aro Granite Industries Ltd has declared a 10% dividend, amounting to ₹1 per share, with an ex-date of August 23, 2019. However, the company has shown significant volatility in total returns over various periods, with a lack of consistent dividend yield.

Aro Granite Industries Ltd has declared a 10% dividend.<BR><BR>Dividend Details:<BR>- Percentage announced: 10%<BR>- Amount per share: 1 per share<BR>- Ex-date: 23 Aug 19<BR><BR>Dividend Yield: 0%<BR><BR>Total Returns by Period:<BR>In the 6 months period, the price return was -23.47%, the dividend return was 0%, resulting in a total return of -23.47%.<BR><BR>In the 1 year period, the price return was -28.19%, the dividend return was 0%, resulting in a total return of -28.19%.<BR><BR>In the 2 years period, the price return was -4.53%, the dividend return was 0%, resulting in a total return of -4.53%.<BR><BR>In the 3 years period, the price return was -12.31%, the dividend return was 0%, resulting in a total return of -12.31%.<BR><BR>In the 4 years period, the price return was -30.69%, the dividend return was 0%, resulting in a total return of -30.69%.<BR><BR>In the 5 years period, the price return was 53.99%, the dividend return was 0%, resulting in a total return of 53.99%.<BR><BR>Overall, Aro Granite Industries Ltd has declared a dividend, but the total returns over various periods indicate significant volatility, particularly in the short to medium term, with a notable recovery in the long term. The lack of dividend yield suggests that the company has not consistently provided returns to shareholders through dividends.

View full answer
iScoreScore
Click here to find our call on this stock
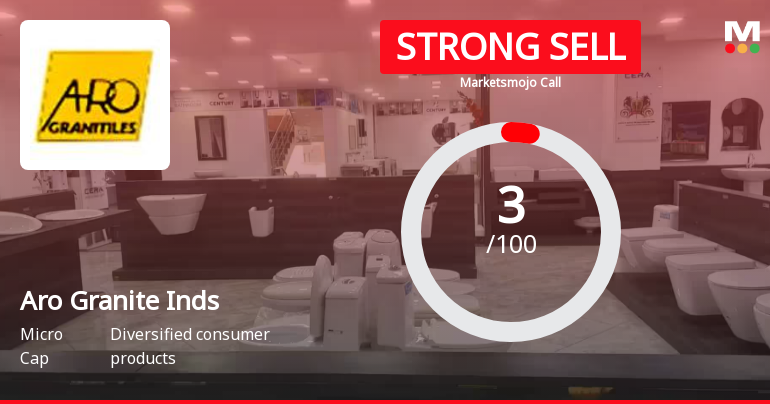
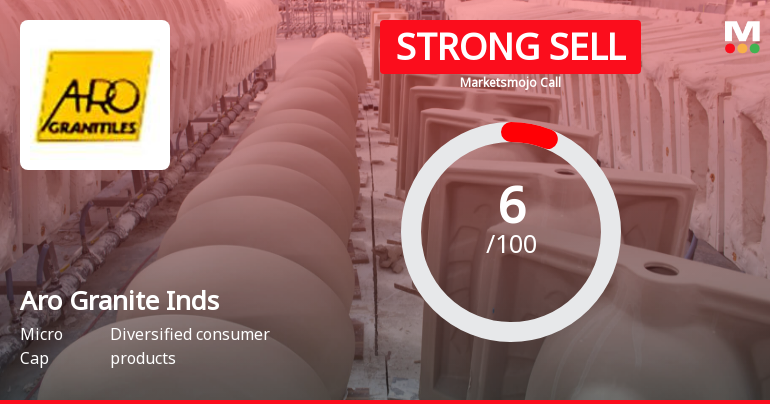
Strong Sell
Sell
Hold
Buy
Strong Buy

Dashboard

1

With a Operating Losses, the company has a Weak Long Term Fundamental Strength

  • Low ability to service debt as the company has a high Debt to EBITDA ratio of 101.74 times
  • The company has been able to generate a Return on Equity (avg) of 1.13% signifying low profitability per unit of shareholders funds
2

The company has declared Negative results for the last 4 consecutive quarters

3

Risky - Negative EBITDA

4

Consistent Underperformance against the benchmark over the last 3 years

stock-summaryMojo Parameters

Mojo Parameters

Loading Valuation Snapshot...

Stock DNA

stock-summary
Industry

Diversified consumer products

stock-summary
Market cap

INR 37 Cr (Micro Cap)

stock-summary
P/E

NA (Loss Making)

stock-summary
Industry P/E

29

stock-summary
Dividend Yield

0.00%

stock-summary
Debt Equity

0.80

stock-summary
Return on Equity

-11.11%

stock-summary
Price to Book

0.22

Revenue and Profits:
Net Sales:
21 Cr
(Quarterly Results - Jun 2026)
Net Profit:
-7 Cr
stock-summaryTotal Returns
Total Returns (Price + Dividend) stock-summary
Dividend Yield (0%)
TimePeriod
Price Return
Dividend Return
Total Return
3 Months
-7.24%
0%
-7.24%
6 Months
-8.85%
0%
-8.85%
1 Year
-32.76%
0%
-32.76%
2 Years
-59.89%
0%
-59.89%
3 Years
-52.77%
0%
-52.77%
4 Years
-52.92%
0%
-52.92%
5 Years
-65.43%
0%
-65.43%

Latest dividend: 1 per share ex-dividend date: Aug-23-2019

Risk Adjusted Returns v/s stock-summary
Returns Beta
Icon
Beta has not been calculated since enough price history is not available
stock-summaryNews & Corporate Actions

Announcements stock-summary

Letter Sent To Shareholders For Annual Report Web-Link

11-Aug-2026 | Source : BSE

Letter sent to Shareholders for Annual Report Web-Link

Announcement under Regulation 30 (LODR)-Newspaper Publication

11-Aug-2026 | Source : BSE

Newspaper Publication

Book Closure For 38Th AGM Of The Company

10-Aug-2026 | Source : BSE

Book Closure for 38th AGM of the Company

Corporate Actions stock-summary

stock-summary
BOARD MEETING

No Upcoming Board Meetings

stock-summary
DIVIDEND

Aro Granite Industries Ltd has declared 10% dividend, ex-date: 23 Aug 19

stock-summary
SPLITS

No Splits history available

stock-summary
BONUS

Aro Granite Industries Ltd has announced 1:2 bonus issue, ex-date: 30 Oct 13

stock-summary
RIGHTS

No Rights history available

stock-summaryKey Factors

Quality key factors stock-summary

Factor
Value
Sales Growth (5y)
-20.03%
EBIT Growth (5y)
-199.20%
EBIT to Interest (avg)
0.33
Debt to EBITDA (avg)
20.45
Net Debt to Equity (avg)
0.80
Sales to Capital Employed (avg)
0.42
Tax Ratio
0.68%
Dividend Payout Ratio
0
Pledged Shares
0
Institutional Holding
0
ROCE (avg)
1.87%
ROE (avg)
1.13%

Valuation key factors

Factor
Value
P/E Ratio
NA (Loss Making)
Industry P/E
29
Price to Book Value
0.21
EV to EBIT
-10.58
EV to EBITDA
-25.96
EV to Capital Employed
0.56
EV to Sales
2.62
PEG Ratio
NA
Dividend Yield
NA
ROCE (Latest)
-2.66%
ROE (Latest)
-11.11%

Technicals key factors

Indicator
Weekly
Monthly
MACD
Mildly Bullish
Mildly Bullish
RSI
No Signal
No Signal
Bollinger Bands
Bearish
Bearish
Moving Averages
Bearish (Daily)
KST
Bearish
Bearish
Dow Theory
No Trend
No Trend
OBV
No Trend
No Trend
stock-summary Technical Indicator Scale: Bearish, Mildly Bearish, Sideways, Mildly Bullish, Bullish  Turned 
stock-summaryShareholding
Shareholding Snapshot : Jun 2026stock-summary
Shareholding Compare (%holding) stock-summary
Majority shareholders

Non Institution

Pledged Promoter Holdings

None

Mutual Funds

Held by 0 Schemes

FIIs

Held by 0 FIIs

Promoter with highest holding

Sunil K Arora (33.16%)

Highest Public shareholder

Dilipkumar Lakhi (4%)

Individual Investors Holdings

50.14%

stock-summaryFinancial
[
  {
    "link": "quarterly",
    "btn_text": "All Quarterly Results",
    "header": "Quarterly Results Snapshot (Standalone) - Jun'26 - QoQ",
    "rhs": [
      {
        "prefix": "Net Sales ",
        "suffix": "QoQ Growth in quarter ended Jun 2026 is 78.99% vs -21.58% in Mar 2026",
        "dir": 1
      },
      {
        "prefix": "Standalone Net Profit ",
        "suffix": "QoQ Growth in quarter ended Jun 2026 is -16.22% vs -115.82% in Mar 2026",
        "dir": 1
      }
    ],
    "table": {
      "header": [
        "Jun'26",
        "Mar'26",
        "Change(%)"
      ],
      "body": [
        {
          "field": "Net Sales",
          "val1": "20.62",
          "val2": "11.52",
          "chgp": "78.99%",
          "chgp_class": "positive"
        },
        {
          "field": "Operating Profit (PBDIT) excl Other Income",
          "val1": "-2.67",
          "val2": "-2.79",
          "chgp": "4.30%",
          "chgp_class": "positive"
        },
        {
          "field": "Interest",
          "val1": "2.92",
          "val2": "3.58",
          "chgp": "-18.44%",
          "chgp_class": "positive"
        },
        {
          "field": "Exceptional Items",
          "val1": "0.00",
          "val2": "0.00",
          "chgp": "",
          "chgp_class": "neutral"
        },
        {
          "field": "Standalone Net Profit",
          "val1": "-7.45",
          "val2": "-6.41",
          "chgp": "-16.22%",
          "chgp_class": "negative"
        },
        {
          "field": "Operating Profit Margin (Excl OI)",
          "val1": "-12.95%",
          "val2": "-24.22%",
          "chgp": "11.27%",
          "chgp_class": "positive"
        }
      ]
    }
  },
  {
    "link": "half-yearly",
    "btn_text": "All Half Yearly Results",
    "header": "Half Yearly Results Snapshot (Standalone) - Sep'25",
    "rhs": [
      {
        "prefix": "Net Sales ",
        "suffix": " Growth in half year ended Sep 2025 is -28.49% vs -25.54% in Sep 2024",
        "dir": -1
      },
      {
        "prefix": "Standalone Net Profit ",
        "suffix": " Growth in half year ended Sep 2025 is 62.11% vs -476.61% in Sep 2024",
        "dir": 1
      }
    ],
    "table": {
      "header": [
        "Sep'25",
        "Sep'24",
        "Change(%)"
      ],
      "body": [
        {
          "field": "Net Sales",
          "val1": "47.31",
          "val2": "66.16",
          "chgp": "-28.49%",
          "chgp_class": "negative"
        },
        {
          "field": "Operating Profit (PBDIT) excl Other Income",
          "val1": "6.06",
          "val2": "5.17",
          "chgp": "17.21%",
          "chgp_class": "positive"
        },
        {
          "field": "Interest",
          "val1": "7.75",
          "val2": "6.63",
          "chgp": "16.89%",
          "chgp_class": "negative"
        },
        {
          "field": "Exceptional Items",
          "val1": "0.00",
          "val2": "0.00",
          "chgp": "",
          "chgp_class": "neutral"
        },
        {
          "field": "Standalone Net Profit",
          "val1": "-2.44",
          "val2": "-6.44",
          "chgp": "62.11%",
          "chgp_class": "positive"
        },
        {
          "field": "Operating Profit Margin (Excl OI)",
          "val1": "12.81%",
          "val2": "7.81%",
          "chgp": "5.00%",
          "chgp_class": "positive"
        }
      ]
    }
  },
  {
    "link": "nine-monthly",
    "btn_text": "All Nine Monthly Results",
    "header": "Nine Monthly Results Snapshot (Standalone) - Dec'25",
    "rhs": [
      {
        "prefix": "Net Sales ",
        "suffix": "YoY Growth in nine months ended Dec 2025 is -35.60% vs -21.21% in Dec 2024",
        "dir": -1
      },
      {
        "prefix": "Standalone Net Profit ",
        "suffix": "YoY Growth in nine months ended Dec 2025 is 15.99% vs -459.78% in Dec 2024",
        "dir": 1
      }
    ],
    "table": {
      "header": [
        "Dec'25",
        "Dec'24",
        "Change(%)"
      ],
      "body": [
        {
          "field": "Net Sales",
          "val1": "62.00",
          "val2": "96.28",
          "chgp": "-35.60%",
          "chgp_class": "negative"
        },
        {
          "field": "Operating Profit (PBDIT) excl Other Income",
          "val1": "4.30",
          "val2": "5.61",
          "chgp": "-23.35%",
          "chgp_class": "negative"
        },
        {
          "field": "Interest",
          "val1": "11.53",
          "val2": "9.60",
          "chgp": "20.10%",
          "chgp_class": "negative"
        },
        {
          "field": "Exceptional Items",
          "val1": "0.00",
          "val2": "0.00",
          "chgp": "",
          "chgp_class": "neutral"
        },
        {
          "field": "Standalone Net Profit",
          "val1": "-5.41",
          "val2": "-6.44",
          "chgp": "15.99%",
          "chgp_class": "positive"
        },
        {
          "field": "Operating Profit Margin (Excl OI)",
          "val1": "6.94%",
          "val2": "5.83%",
          "chgp": "1.11%",
          "chgp_class": "positive"
        }
      ]
    }
  },
  {
    "link": "annual",
    "btn_text": "All Annual Results",
    "header": "Annual Results Snapshot (Standalone) - Mar'26",
    "rhs": [
      {
        "prefix": "Net Sales ",
        "suffix": "YoY Growth in year ended Mar 2026 is -40.27% vs -20.63% in Mar 2025",
        "dir": -1
      },
      {
        "prefix": "Standalone Net Profit ",
        "suffix": "YoY Growth in year ended Mar 2026 is -84.11% vs -590.08% in Mar 2025",
        "dir": 1
      }
    ],
    "table": {
      "header": [
        "Mar'26",
        "Mar'25",
        "Change(%)"
      ],
      "body": [
        {
          "field": "Net Sales",
          "val1": "73.52",
          "val2": "123.09",
          "chgp": "-40.27%",
          "chgp_class": "negative"
        },
        {
          "field": "Operating Profit (PBDIT) excl Other Income",
          "val1": "1.51",
          "val2": "6.30",
          "chgp": "-76.03%",
          "chgp_class": "negative"
        },
        {
          "field": "Interest",
          "val1": "15.11",
          "val2": "12.87",
          "chgp": "17.40%",
          "chgp_class": "negative"
        },
        {
          "field": "Exceptional Items",
          "val1": "0.00",
          "val2": "0.00",
          "chgp": "",
          "chgp_class": "neutral"
        },
        {
          "field": "Standalone Net Profit",
          "val1": "-11.82",
          "val2": "-6.42",
          "chgp": "-84.11%",
          "chgp_class": "negative"
        },
        {
          "field": "Operating Profit Margin (Excl OI)",
          "val1": "2.05%",
          "val2": "5.12%",
          "chgp": "-3.07%",
          "chgp_class": "negative"
        }
      ]
    }
  }
]

Quarterly Results Snapshot (Standalone) - Jun'26 - QoQstock-summary

Jun'26
Mar'26
Change(%)
Net Sales
20.62
11.52
78.99%
Operating Profit (PBDIT) excl Other Income
-2.67
-2.79
4.30%
Interest
2.92
3.58
-18.44%
Exceptional Items
0.00
0.00
Standalone Net Profit
-7.45
-6.41
-16.22%
Operating Profit Margin (Excl OI)
-12.95%
-24.22%
11.27%
Values in Rs Cr.
Direction Arrows
Net Sales

QoQ Growth in quarter ended Jun 2026 is 78.99% vs -21.58% in Mar 2026

Direction Arrows
Standalone Net Profit

QoQ Growth in quarter ended Jun 2026 is -16.22% vs -115.82% in Mar 2026

Half Yearly Results Snapshot (Standalone) - Sep'25stock-summary

Sep'25
Sep'24
Change(%)
Net Sales
47.31
66.16
-28.49%
Operating Profit (PBDIT) excl Other Income
6.06
5.17
17.21%
Interest
7.75
6.63
16.89%
Exceptional Items
0.00
0.00
Standalone Net Profit
-2.44
-6.44
62.11%
Operating Profit Margin (Excl OI)
12.81%
7.81%
5.00%
Values in Rs Cr.
Direction Arrows
Net Sales

Growth in half year ended Sep 2025 is -28.49% vs -25.54% in Sep 2024

Direction Arrows
Standalone Net Profit

Growth in half year ended Sep 2025 is 62.11% vs -476.61% in Sep 2024

Nine Monthly Results Snapshot (Standalone) - Dec'25stock-summary

Dec'25
Dec'24
Change(%)
Net Sales
62.00
96.28
-35.60%
Operating Profit (PBDIT) excl Other Income
4.30
5.61
-23.35%
Interest
11.53
9.60
20.10%
Exceptional Items
0.00
0.00
Standalone Net Profit
-5.41
-6.44
15.99%
Operating Profit Margin (Excl OI)
6.94%
5.83%
1.11%
Values in Rs Cr.
Direction Arrows
Net Sales

YoY Growth in nine months ended Dec 2025 is -35.60% vs -21.21% in Dec 2024

Direction Arrows
Standalone Net Profit

YoY Growth in nine months ended Dec 2025 is 15.99% vs -459.78% in Dec 2024

Annual Results Snapshot (Standalone) - Mar'26stock-summary

Mar'26
Mar'25
Change(%)
Net Sales
73.52
123.09
-40.27%
Operating Profit (PBDIT) excl Other Income
1.51
6.30
-76.03%
Interest
15.11
12.87
17.40%
Exceptional Items
0.00
0.00
Standalone Net Profit
-11.82
-6.42
-84.11%
Operating Profit Margin (Excl OI)
2.05%
5.12%
-3.07%
Values in Rs Cr.
Direction Arrows
Net Sales

YoY Growth in year ended Mar 2026 is -40.27% vs -20.63% in Mar 2025

Direction Arrows
Standalone Net Profit

YoY Growth in year ended Mar 2026 is -84.11% vs -590.08% in Mar 2025

stock-summaryCompany CV
About Aro Granite Industries Ltd stock-summary
stock-summary
Aro Granite Industries Ltd
Micro Cap
Diversified consumer products
Aro Granite Industries Limited, incorporated in 1988 is engaged as a manufacturer and exporter of Granite Slabs and Tiles from India. Company has a 100% EOU located in Hosur, Tamil Nadu. Company has a wide product portfolio of granite slabs, granite tiles, Quartzite slabs, Cut-To-Size granite tiles and Quartz slabs and tiles. It uses the most modern technology and machinery in its plants for cutting raw blocks and polishing of slabs and tiles.
Company Coordinates stock-summary
Company Details
1001 10th Floor, DLF Tower A Jasola New Delhi New Delhi : 110025
stock-summary
Tel: 91-11-41686169
stock-summary
investorsgrievance@arotile.com
Registrar Details
Alankit Assignments Ltd , Alankit House , 2 E/21, Jhandewala Extension, New Delhi