
Compare Arrow Greentech with Similar Stocks
Dashboard
The company is Net-Debt Free
Healthy long term growth as Net Sales has grown by an annual rate of 30.79% and Operating profit at 72.40%
Negative results in Mar 26
With ROE of 20.2, it has a Very Expensive valuation with a 3.8 Price to Book Value
Despite the size of the company, domestic mutual funds hold only 0% of the company
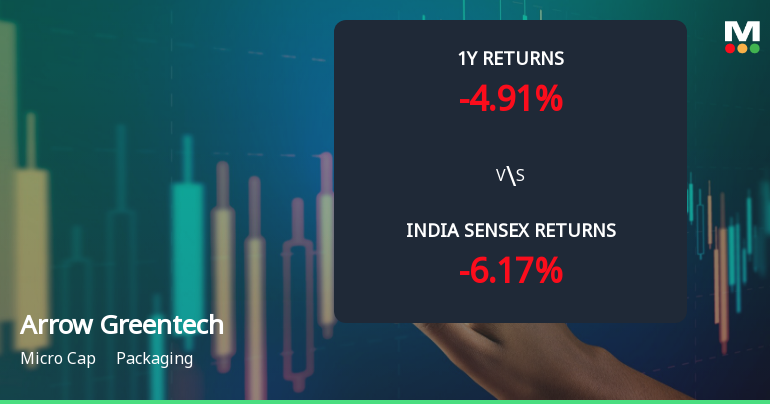
Total Returns (Price + Dividend) 
Latest dividend: 4 per share ex-dividend date: Sep-18-2025
Risk Adjusted Returns v/s
Returns Beta

News
Arrow Greentech Ltd Technical Momentum Shifts Amid Mixed Indicator Signals
Arrow Greentech Ltd, a micro-cap player in the packaging sector, has experienced a nuanced shift in its technical momentum, reflecting a complex interplay of bullish and bearish signals across multiple timeframes. Recent changes in key technical parameters suggest a transition from a previously bearish stance to a mildly bullish outlook, though caution remains warranted given mixed indicator readings.
Read full news article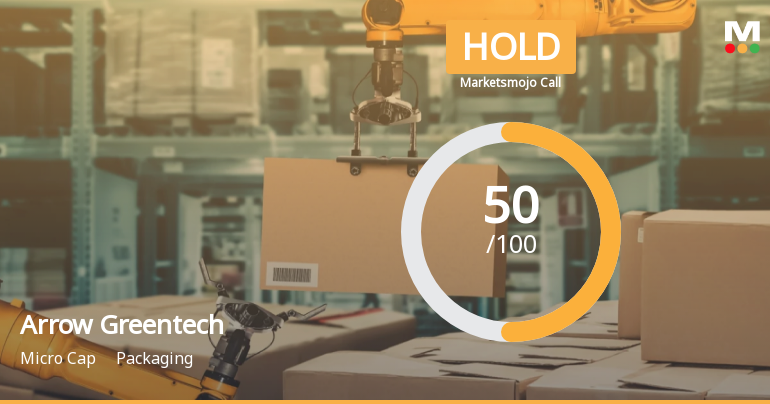
Arrow Greentech Ltd Upgraded to Hold on Technical Improvements and Valuation Balance
Arrow Greentech Ltd, a micro-cap player in the packaging sector, has seen its investment rating upgraded from Sell to Hold as of 23 June 2026. This change reflects a nuanced improvement across technical indicators and valuation metrics, despite recent quarterly financial setbacks. The company’s net-debt free status and strong long-term sales growth underpin this reassessment, signalling cautious optimism among analysts.
Read full news article
Arrow Greentech Ltd Technical Momentum Shifts Signal Bullish Outlook
Arrow Greentech Ltd, a micro-cap player in the packaging sector, has witnessed a notable shift in its technical momentum, upgrading from a previous sell rating to a hold with a Mojo Score of 50.0. This change reflects improving price action and bullish signals across key technical indicators, signalling potential for further gains despite mixed monthly trends.
Read full news article Announcements
Announcement under Regulation 30 (LODR)-Analyst / Investor Meet - Intimation
16-Jun-2026 | Source : BSEAnalyst/ Investor Meet
Announcement under Regulation 30 (LODR)-Analyst / Investor Meet - Intimation
10-Jun-2026 | Source : BSEIntimation of Analyst Meet
Compliances-Reg.24(A)-Annual Secretarial Compliance
28-May-2026 | Source : BSEAnnual Secretarial Compliance Report
Corporate Actions

No Upcoming Board Meetings

Arrow Greentech Ltd has declared 40% dividend, ex-date: 18 Sep 25

No Splits history available

No Bonus history available

Arrow Greentech Ltd has announced 1:5 rights issue, ex-date: 12 Feb 20
Quality key factors
Valuation key factors
Technicals key factors
 Technical Indicator Scale: Bearish, Mildly Bearish, Sideways, Mildly Bullish, Bullish Turned
 Shareholding Snapshot : Mar 2026
Shareholding Compare (%holding)
Promoters
None
Held by 0 Schemes
Held by 3 FIIs (0.07%)
Shilpan Pravin Patel (34.73%)
Ramesh Thakurdas Jaisinghani (1.23%)
27.72%
Quarterly Results Snapshot (Consolidated) - Mar'26 - YoY

YoY Growth in quarter ended Mar 2026 is -27.07% vs 13.18% in Mar 2025
YoY Growth in quarter ended Mar 2026 is -35.31% vs 12.93% in Mar 2025
Half Yearly Results Snapshot (Consolidated) - Sep'25
Growth in half year ended Sep 2025 is -21.60% vs 79.43% in Sep 2024
Growth in half year ended Sep 2025 is -31.38% vs 168.84% in Sep 2024
Nine Monthly Results Snapshot (Consolidated) - Dec'25
YoY Growth in nine months ended Dec 2025 is -14.69% vs 90.07% in Dec 2024
YoY Growth in nine months ended Dec 2025 is -22.70% vs 167.22% in Dec 2024
Annual Results Snapshot (Consolidated) - Mar'26
YoY Growth in year ended Mar 2026 is -17.60% vs 63.86% in Mar 2025
YoY Growth in year ended Mar 2026 is -25.00% vs 113.93% in Mar 2025
About Arrow Greentech Ltd

Company Coordinates


