
Compare Artemis Electri. with Similar Stocks
Dashboard
Weak Long Term Fundamental Strength with an average Return on Equity (ROE) of 7.82%
- Poor long term growth as Net Sales has grown by an annual rate of 11.43% and Operating profit at 7.18% over the last 5 years
Flat results in Mar 26
With ROE of 9.2, it has a Very Expensive valuation with a 4.2 Price to Book Value
Below par performance in long term as well as near term
Stock DNA
Other Electrical Equipment
INR 403 Cr (Micro Cap)
46.00
61
0.00%
-0.13
9.20%
4.25
Total Returns (Price + Dividend) 
Latest dividend: 0 per share ex-dividend date: Feb-17-2025
Risk Adjusted Returns v/s
Returns Beta

News
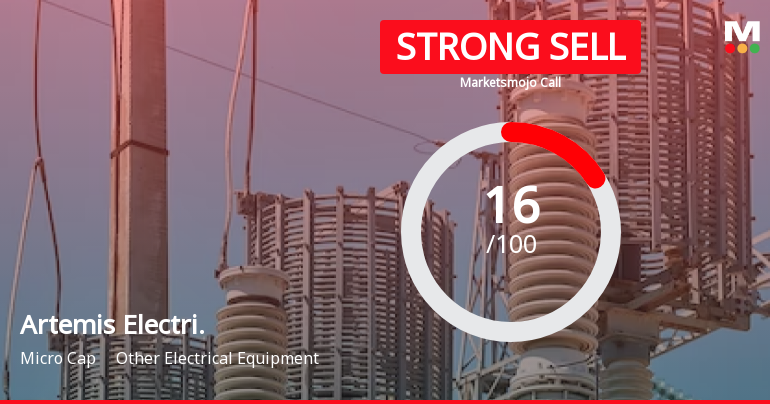
Artemis Electricals & Projects Ltd is Rated Strong Sell
Artemis Electricals & Projects Ltd is rated Strong Sell by MarketsMOJO, with this rating last updated on 13 February 2026. However, the analysis and financial metrics discussed here reflect the stock’s current position as of 18 July 2026, providing investors with an up-to-date perspective on the company’s performance and outlook.
Read full news article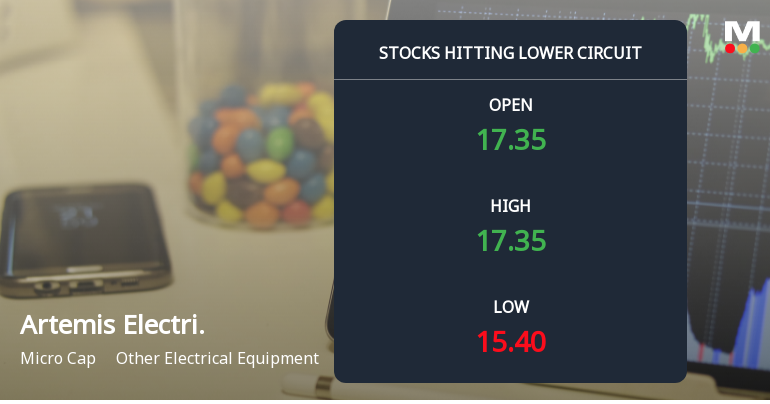
Artemis Electricals & Projects Ltd Locks at Lower Circuit With 10% Loss — Sellers Queue, No Buyers in Sight
At Rs 14.44, sellers were still queuing — but there were no buyers willing to take the other side. Artemis Electricals & Projects Ltd locked at its lower circuit of 10% on 14 Jul 2026, with unfilled sell orders and a frozen price.
Read full news article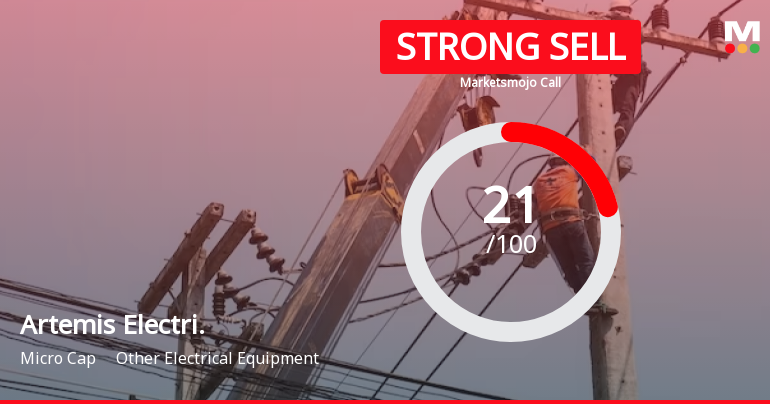
Artemis Electricals & Projects Ltd is Rated Strong Sell
Artemis Electricals & Projects Ltd is rated Strong Sell by MarketsMOJO, with this rating last updated on 13 Feb 2026. However, the analysis and financial metrics discussed here reflect the stock’s current position as of 07 July 2026, providing investors with an up-to-date view of its fundamentals, returns, and overall outlook.
Read full news article Announcements
Compliances-Certificate under Reg. 74 (5) of SEBI (DP) Regulations 2018
13-Jul-2026 | Source : BSECertificate under Regulation 74(5) of SEBI (Depositories and Participants) Regulations 2018 for the quarter ended 30th June 2026
Closure of Trading Window
26-Jun-2026 | Source : BSEIntimation for Closure of Trading Window with effect from 01st July 2026
Announcement under Regulation 30 (LODR)-Change in Management
09-Jun-2026 | Source : BSEArtemis Electricals and Projects Limited has informed the Stock Exchange about the Change in Management of the Company.
Corporate Actions

No Upcoming Board Meetings


Artemis Electricals & Projects Ltd has announced 1:10 stock split, ex-date: 31 Mar 23

No Bonus history available

No Rights history available
Quality key factors
Valuation key factors
Technicals key factors
 Technical Indicator Scale: Bearish, Mildly Bearish, Sideways, Mildly Bullish, Bullish Turned
 Shareholding Snapshot : Jun 2026
Shareholding Compare (%holding)
Promoters
20.6701
Held by 0 Schemes
Held by 0 FIIs
Yashvikram Infrastructure Private Limited (22.82%)
Master Merchants Pvt Ltd (11.05%)
7.55%
Quarterly Results Snapshot (Consolidated) - Mar'26 - QoQ

QoQ Growth in quarter ended Mar 2026 is 856.57% vs -73.04% in Dec 2025
QoQ Growth in quarter ended Mar 2026 is 282.50% vs -77.40% in Dec 2025
Half Yearly Results Snapshot (Consolidated) - Sep'25
Growth in half year ended Sep 2025 is 116.77% vs -34.19% in Sep 2024
Growth in half year ended Sep 2025 is 344.95% vs -44.10% in Sep 2024
Nine Monthly Results Snapshot (Consolidated) - Dec'25
YoY Growth in nine months ended Dec 2025 is 14.23% vs -10.39% in Dec 2024
YoY Growth in nine months ended Dec 2025 is 52.29% vs 11.75% in Dec 2024
Annual Results Snapshot (Consolidated) - Mar'26

YoY Growth in year ended Mar 2026 is 11.35% vs 74.93% in Mar 2025
YoY Growth in year ended Mar 2026 is 15.21% vs 93.85% in Mar 2025
About Artemis Electricals & Projects Ltd

Company Coordinates


