
Compare Arvee Laborat. with Similar Stocks
Dashboard
Weak Long Term Fundamental Strength with a -9.66% CAGR growth in Operating Profits over the last 5 years
- The company has been able to generate a Return on Equity (avg) of 9.21% signifying low profitability per unit of shareholders funds
With ROE of 7.5, it has a Very Expensive valuation with a 5.4 Price to Book Value
Below par performance in long term as well as near term
Stock DNA
Chemicals & Petrochemicals
INR 187 Cr (Micro Cap)
72.00
45
0.00%
-0.06
7.49%
5.46
Total Returns (Price + Dividend) 
Arvee Laborat. for the last several years.
Risk Adjusted Returns v/s
Returns Beta

News
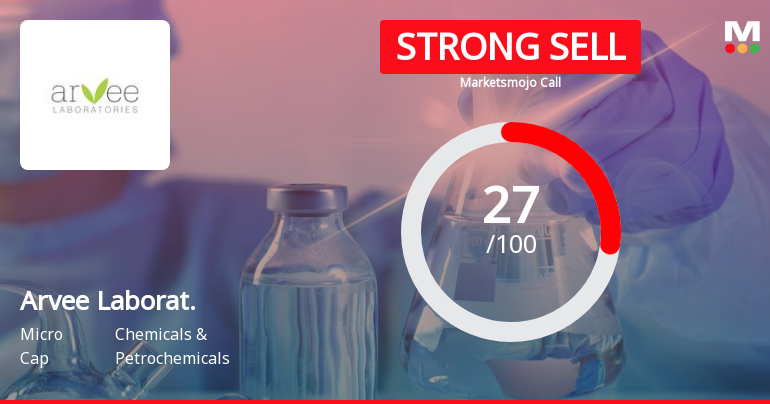
Arvee Laboratories (India) Ltd is Rated Strong Sell
Arvee Laboratories (India) Ltd is rated Strong Sell by MarketsMOJO. This rating was last updated on 18 June 2026. However, the analysis and financial metrics discussed below reflect the stock’s current position as of 23 June 2026, providing investors with the most up-to-date view of the company’s fundamentals, returns, and market performance.
Read full news article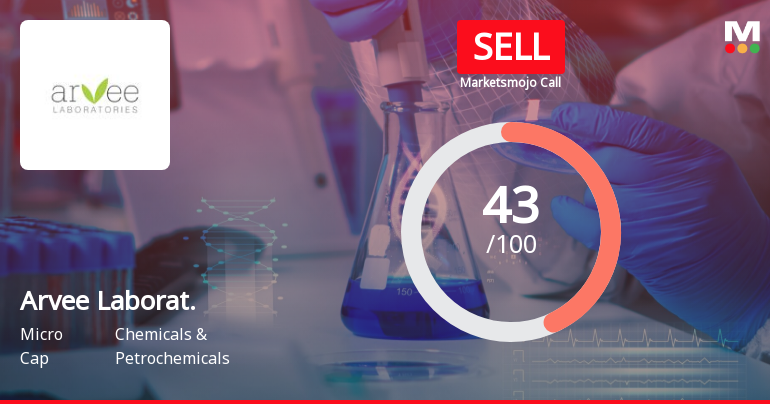
Arvee Laboratories (India) Ltd is Rated Sell
Arvee Laboratories (India) Ltd is rated 'Sell' by MarketsMOJO, with this rating last updated on 11 June 2026. However, the analysis and financial metrics discussed here reflect the stock's current position as of 12 June 2026, providing investors with the most up-to-date perspective on the company’s standing.
Read full news article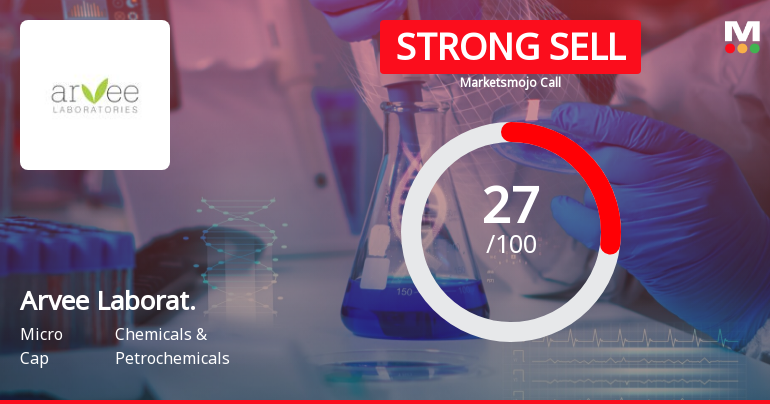
Arvee Laboratories (India) Ltd is Rated Strong Sell
Arvee Laboratories (India) Ltd is rated Strong Sell by MarketsMOJO, with this rating last updated on 24 Feb 2026. However, the analysis and financial metrics discussed here reflect the stock’s current position as of 31 May 2026, providing investors with the latest insights into its performance and outlook.
Read full news article Announcements
Arvee Laboratories (India) Limited - Clarification - Financial Results
03-Dec-2019 | Source : NSEArvee Laboratories (India) Limitedies (India) Limited for the quarter ended 30-Sep-2019 with respect to Regulation 33 of the SEBI (Listing Obligations and Disclosure Requirements) Regulations, 2015.
Arvee Laboratories (India) Limited - Outcome of Board Meeting
14-Nov-2019 | Source : NSEArvee Laboratories (India) Limited has informed the Exchange regarding Board meeting held on November 14, 2019.
Corporate Actions

No Upcoming Board Meetings

No Dividend history available

No Splits history available

Arvee Laboratories (India) Ltd has announced 1:1 bonus issue, ex-date: 13 Oct 20

No Rights history available
Quality key factors
Valuation key factors
Technicals key factors
 Technical Indicator Scale: Bearish, Mildly Bearish, Sideways, Mildly Bullish, Bullish Turned
 Shareholding Snapshot : Mar 2026
Shareholding Compare (%holding)
Promoters
None
Held by 0 Schemes
Held by 0 FIIs
Shalin Sudhakarbhai Patel (36.68%)
Gitaben Dinehsbhai Patel (9.98%)
26.21%
Quarterly Results Snapshot (Standalone) - Mar'26 - YoY

YoY Growth in quarter ended Mar 2026 is 67.44% vs 5.05% in Mar 2025
YoY Growth in quarter ended Mar 2026 is 642.86% vs -41.67% in Mar 2025
Half Yearly Results Snapshot (Standalone) - Sep'25

Growth in half year ended Sep 2025 is -52.75% vs 40.10% in Sep 2024
Growth in half year ended Sep 2025 is -90.62% vs 174.29% in Sep 2024
Nine Monthly Results Snapshot (Standalone) - Dec'25
YoY Growth in nine months ended Dec 2025 is -35.36% vs 32.34% in Dec 2024
YoY Growth in nine months ended Dec 2025 is -2.90% vs 120.21% in Dec 2024
Annual Results Snapshot (Standalone) - Mar'26
YoY Growth in year ended Mar 2026 is -18.13% vs 26.82% in Mar 2025
YoY Growth in year ended Mar 2026 is 17.67% vs 104.76% in Mar 2025
About Arvee Laboratories (India) Ltd

Company Coordinates


