
Compare Aryaman Fin.Serv with Similar Stocks
Dashboard
With a fall in EPS of -45.16%, the company declared Very Negative results in Mar 26
- The company has declared negative results for the last 2 consecutive quarters
- The company has declared negative results in Dec 25 after 4 consecutive negative quarters
- PAT(Q) At Rs 4.59 cr has Fallen at -45.2%
- NET SALES(Q) Lowest at Rs 10.48 cr
- PBDIT(Q) Lowest at Rs 4.86 cr.
With ROE of 18.4, it has a Expensive valuation with a 4.5 Price to Book Value
Despite the size of the company, domestic mutual funds hold only 0% of the company
Stock DNA
Non Banking Financial Company (NBFC)
INR 723 Cr (Micro Cap)
24.00
35
0.00%
0.00
18.43%
4.65
Total Returns (Price + Dividend) 
Aryaman Fin.Serv for the last several years.
Risk Adjusted Returns v/s
Returns Beta

News

Aryaman Financial Services Ltd is Rated Strong Sell
Aryaman Financial Services Ltd is rated Strong Sell by MarketsMOJO, with this rating last updated on 14 February 2026. However, the analysis and financial metrics discussed below reflect the stock’s current position as of 09 June 2026, providing investors with an up-to-date perspective on the company’s performance and outlook.
Read full news article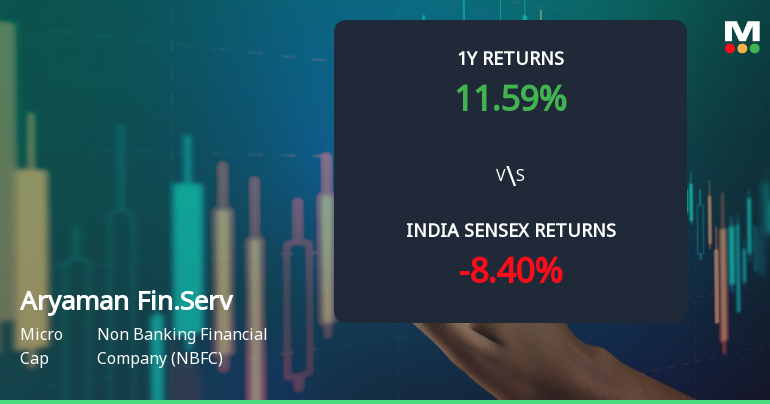
Aryaman Financial Services Ltd Sees Mixed Technical Signals Amid Mild Momentum Shift
Aryaman Financial Services Ltd, a micro-cap player in the Non Banking Financial Company (NBFC) sector, has exhibited a nuanced shift in its technical momentum as of early June 2026. While the stock price has gained 2.51% on the day to ₹599.40, technical indicators present a mixed picture, reflecting a transition from bearish to mildly bearish trends with pockets of bullish signals. This article analyses the recent technical parameter changes, momentum indicators, and price action in the context of broader market performance and investor sentiment.
Read full news article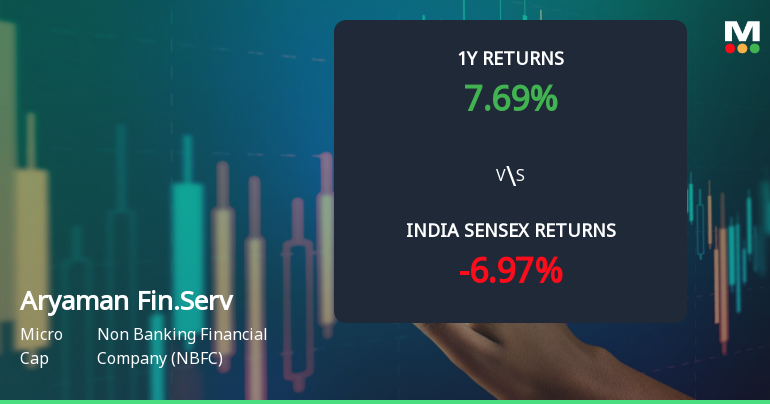
Aryaman Financial Services Ltd Faces Bearish Momentum Amid Technical Downgrade
Aryaman Financial Services Ltd, a micro-cap player in the Non Banking Financial Company (NBFC) sector, has experienced a notable shift in its technical momentum, signalling increased bearishness across multiple timeframes. Despite a strong long-term return profile, recent technical indicators suggest caution for investors as the stock’s momentum deteriorates amid a 2.06% decline in daily price.
Read full news article Announcements
Announcement Under Regulation 30 (LODR) - Investment In Wholly Owned Subsidiary.
03-Jun-2026 | Source : BSEAnnouncement under regulation 30 (LODR) - Investment in Aryaman Finance (India) Limited a Wholly Owned Subsidiary
Compliances-Reg.24(A)-Annual Secretarial Compliance
30-May-2026 | Source : BSECompliance under Regulation 24(A) of SEBI (LODR) Regulations 2015
Announcement under Regulation 30 (LODR)-Newspaper Publication
23-May-2026 | Source : BSENewspaper Advertisement under Regulation 47 read with Regulation 33 of the SEBI (Listing Obligations and Disclosure Requirements) Regulations 2015
Corporate Actions

No Upcoming Board Meetings

No Dividend history available

No Splits history available

No Bonus history available

No Rights history available
Quality key factors
Valuation key factors
Technicals key factors
 Technical Indicator Scale: Bearish, Mildly Bearish, Sideways, Mildly Bullish, Bullish Turned
 Shareholding Snapshot : Mar 2026
Shareholding Compare (%holding)
Promoters
None
Held by 0 Schemes
Held by 0 FIIs
Mahshri Enterprises Pvt Ltd (62.45%)
Precious Tradeways Private Limited (3.92%)
14.13%
Quarterly Results Snapshot (Consolidated) - Mar'26 - YoY

YoY Growth in quarter ended Mar 2026 is -73.43% vs 529.19% in Mar 2025
YoY Growth in quarter ended Mar 2026 is -45.16% vs 771.87% in Mar 2025
Half Yearly Results Snapshot (Consolidated) - Sep'25

Growth in half year ended Sep 2025 is 33.29% vs -16.92% in Sep 2024
Growth in half year ended Sep 2025 is 102.23% vs -22.31% in Sep 2024
Nine Monthly Results Snapshot (Consolidated) - Dec'25
YoY Growth in nine months ended Dec 2025 is -7.76% vs 22.63% in Dec 2024
YoY Growth in nine months ended Dec 2025 is 7.76% vs 39.03% in Dec 2024
Annual Results Snapshot (Consolidated) - Mar'26
YoY Growth in year ended Mar 2026 is -30.73% vs 70.63% in Mar 2025
YoY Growth in year ended Mar 2026 is -6.31% vs 78.81% in Mar 2025
About Aryaman Financial Services Ltd

Company Coordinates


