
Compare Asarfi Hospital with Similar Stocks
Dashboard
Strong ability to service debt as the company has a low Debt to EBITDA ratio of 1.96 times
Healthy long term growth as Net Sales has grown by an annual rate of 27.70% and Operating profit at 34.16%
The company has declared Positive results for the last 4 consecutive quarters
With ROCE of 15.6, it has a Very Attractive valuation with a 3.3 Enterprise value to Capital Employed
Increasing Participation by Institutional Investors
Market Beating Performance
Total Returns (Price + Dividend) 
Asarfi Hospital for the last several years.
Risk Adjusted Returns v/s
Returns Beta

News
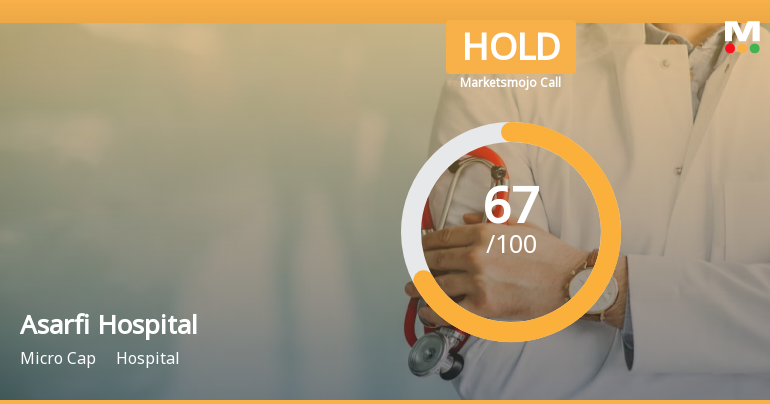
Asarfi Hospital Ltd is Rated Hold
Asarfi Hospital Ltd is rated 'Hold' by MarketsMOJO, with this rating last updated on 6 July 2026. While the rating change occurred on that date, the analysis and financial metrics discussed here reflect the stock's current position as of 16 July 2026, providing investors with the latest insights into the company’s performance and outlook.
Read full news article
Asarfi Hospital Ltd is Rated Buy by MarketsMOJO
Asarfi Hospital Ltd is rated Buy by MarketsMOJO, with this rating last updated on 29 June 2026. While the rating change occurred on that date, the analysis and financial metrics discussed here reflect the stock’s current position as of 05 July 2026, providing investors with the most up-to-date view of the company’s fundamentals, returns, and market performance.
Read full news article
Asarfi Hospital Ltd Downgraded to Hold Amid Mixed Technical and Valuation Signals
Asarfi Hospital Ltd has seen its investment rating downgraded from Buy to Hold as of 23 June 2026, reflecting a nuanced reassessment across quality, valuation, financial trends, and technical indicators. Despite robust financial performance and market-beating returns, evolving technical signals and valuation metrics have prompted a more cautious stance from analysts.
Read full news article Announcements
Announcement under Regulation 30 (LODR)-Analyst / Investor Meet - Intimation
16-Jul-2026 | Source : BSEwe wish to inform you that the Company will participate in an Analyst/Institutional Investor Meeting on dated July 24 2026.
Closure of Trading Window
30-Jun-2026 | Source : BSEWe hereby inform you that the Trading Window for dealing in the securities of the Company shall remain closed for all Designated persons and their Immediate Relative from July01 2026. The Trading window shall reopen 48 hours after the declaration of the Un Audited Financial Results of the Company for the Quarter ended June 302026.
Board Meeting Outcome for Outcome Of Board Meeting Held On 27 June 2026 Under Regulation 30 Of SEBI (Listing Obligations And Disclosure Requirements) Regulations 2015
27-Jun-2026 | Source : BSEWe wish to inform you that the Board of Directors of the Company at its meeting held today i.e. Saturday 27 June 2026 commenced at 3:00 P.M. and concluded at 7:30 P.M. inter alia considered and approved the following: 1. Approval to Participate in PPP Medical College Project 2. Approval for Furnishing Bid Security.
Corporate Actions

No Upcoming Board Meetings

No Dividend history available

No Splits history available

No Bonus history available

No Rights history available
Quality key factors
Valuation key factors
Technicals key factors
 Technical Indicator Scale: Bearish, Mildly Bearish, Sideways, Mildly Bullish, Bullish Turned
 Shareholding Snapshot : Jun 2026
Shareholding Compare (%holding)
Promoters
None
Held by 0 Schemes
Held by 0 FIIs
Harendra Singh (18.78%)
Gopal Singh (2.4%)
30.1%
Quarterly Results Snapshot (Consolidated) - Mar'26 - QoQ

QoQ Growth in quarter ended Mar 2026 is -1.87% vs 2.70% in Dec 2025
QoQ Growth in quarter ended Mar 2026 is -27.68% vs 29.05% in Dec 2025
Half Yearly Results Snapshot (Consolidated) - Mar'26

Growth in half year ended Mar 2026 is 36.38% vs 25.62% in Mar 2025
Growth in half year ended Mar 2026 is 48.96% vs 45.81% in Mar 2025
Nine Monthly Results Snapshot (Standalone) - Dec'24
YoY Growth in nine months ended Dec 2024 is 1.55% vs 5.99% in Mar 2026
YoY Growth in nine months ended Dec 2024 is 16.07% vs -34.33% in Mar 2026
Annual Results Snapshot (Consolidated) - Mar'26
YoY Growth in year ended Mar 2026 is 42.47% vs 44.29% in Mar 2025
YoY Growth in year ended Mar 2026 is 57.47% vs 154.33% in Mar 2025
About Asarfi Hospital Ltd

Company Coordinates


