
Compare Ashapuri Gold with Similar Stocks
Stock DNA
Gems, Jewellery And Watches
INR 136 Cr (Micro Cap)
7.00
47
0.00%
0.00
11.59%
0.85
Total Returns (Price + Dividend) 
Ashapuri Gold for the last several years.
Risk Adjusted Returns v/s
Returns Beta

News
Ashapuri Gold Ornament Ltd is Rated Sell
Ashapuri Gold Ornament Ltd is rated 'Sell' by MarketsMOJO, with this rating last updated on 30 May 2026. However, the analysis and financial metrics discussed here reflect the stock’s current position as of 15 June 2026, providing investors with the latest insights into its performance and outlook.
Read full news article
Ashapuri Gold Ornament Ltd is Rated Sell
Ashapuri Gold Ornament Ltd is rated 'Sell' by MarketsMOJO, with this rating last updated on 30 May 2026. However, the analysis and financial metrics presented here reflect the stock's current position as of 04 June 2026, providing investors with the latest insights into its performance and outlook.
Read full news article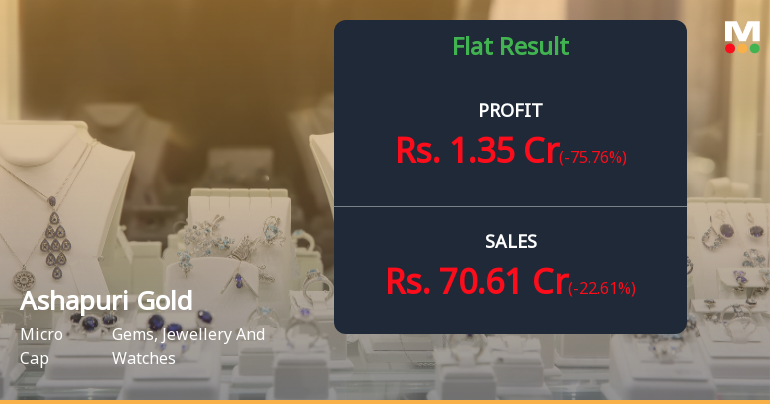
Ashapuri Gold Ornament Q4 FY26: Profitability Plummets Despite Revenue Base
Ashapuri Gold Ornament Ltd., an Ahmedabad-based jewellery manufacturer, reported a challenging fourth quarter for FY26, with net profit plunging 75.78% quarter-on-quarter to ₹1.35 crores from ₹5.57 crores in Q3 FY26. The year-on-year comparison proved equally concerning, with profits rising 68.75% from ₹0.80 crores in Q4 FY25, yet failing to mask the sharp sequential deterioration. The micro-cap stock, currently trading at ₹4.36 with a market capitalisation of ₹149.00 crores, has declined 0.68% following the results announcement, extending a troubling multi-year downtrend that has seen the stock lose 37.71% over the past twelve months.
Read full news article Announcements
Announcement under Regulation 30 (LODR)-Newspaper Publication
30-May-2026 | Source : BSEEnclosed the Newspaper Publication by the Company of the Audited Financial Results for the Quarter and Year Ended March 312026.
Board Meeting Outcome for Meeting Held On 29Th May 2026
29-May-2026 | Source : BSEThe outcome of the Board Meeting held on 29th May 2026 is enclosed.
Audited Financial Results For The Year Ended 31St March 2026
29-May-2026 | Source : BSEThe Audited Results for the year ended March 31 2026 is enclosed.
Corporate Actions

No Upcoming Board Meetings

No Dividend history available

Ashapuri Gold Ornament Ltd has announced 1:10 stock split, ex-date: 18 Jul 23

No Bonus history available

Ashapuri Gold Ornament Ltd has announced 1:3 rights issue, ex-date: 18 Apr 24
Quality key factors
Valuation key factors
Technicals key factors
 Technical Indicator Scale: Bearish, Mildly Bearish, Sideways, Mildly Bullish, Bullish Turned
 Shareholding Snapshot : Mar 2026
Shareholding Compare (%holding)
Non Institution
None
Held by 0 Schemes
Held by 0 FIIs
Soni Saremal Champalal (9.66%)
None
48.11%
Quarterly Results Snapshot (Standalone) - Mar'26 - QoQ

QoQ Growth in quarter ended Mar 2026 is -22.61% vs -10.90% in Dec 2025
QoQ Growth in quarter ended Mar 2026 is -75.76% vs -34.24% in Dec 2025
Half Yearly Results Snapshot (Standalone) - Sep'25
Growth in half year ended Sep 2025 is 18.49% vs 103.60% in Sep 2024
Growth in half year ended Sep 2025 is 92.08% vs 166.96% in Sep 2024
Nine Monthly Results Snapshot (Standalone) - Dec'25
YoY Growth in nine months ended Dec 2025 is 6.03% vs 103.35% in Dec 2024
YoY Growth in nine months ended Dec 2025 is 53.25% vs 158.16% in Dec 2024
Annual Results Snapshot (Standalone) - Mar'26
YoY Growth in year ended Mar 2026 is 0.29% vs 91.62% in Mar 2025
YoY Growth in year ended Mar 2026 is 54.15% vs 56.98% in Mar 2025
About Ashapuri Gold Ornament Ltd

Company Coordinates


