
Compare Ashirwad Steels with Similar Stocks
Dashboard
Weak Long Term Fundamental Strength with an average Return on Equity (ROE) of 2.15%
- Poor long term growth as Net Sales has grown by an annual rate of 7.00% and Operating profit at 16.85% over the last 5 years
- Company's ability to service its debt is weak with a poor EBIT to Interest (avg) ratio of -0.49
Flat results in Mar 26
With ROE of 2.4, it has a Very Expensive valuation with a 0.3 Price to Book Value
Underperformed the market in the last 1 year
Stock DNA
Iron & Steel Products
INR 30 Cr (Micro Cap)
15.00
25
0.00%
-0.01
2.37%
0.35
Total Returns (Price + Dividend) 
Ashirwad Steels for the last several years.
Risk Adjusted Returns v/s
Returns Beta

News
Ashirwad Steels & Industries Ltd is Rated Strong Sell
Ashirwad Steels & Industries Ltd is rated Strong Sell by MarketsMOJO. This rating was last updated on 31 Jul 2024. However, the analysis and financial metrics discussed below reflect the stock’s current position as of 28 May 2026, providing investors with an up-to-date view of the company’s fundamentals, valuation, financial trend, and technical outlook.
Read full news articleAre Ashirwad Steels & Industries Ltd latest results good or bad?
The latest financial results for Ashirwad Steels & Industries Ltd for Q4 FY26 present a complex picture of the company's operational performance. The company reported net sales of ₹0.81 crores, reflecting a sequential growth of 50.00% compared to the previous quarter, which is a notable improvement. However, this figure represents a decline of 2.41% year-on-year from ₹0.83 crores in Q4 FY25, indicating challenges in maintaining consistent revenue generation. Net profit for the quarter was ₹0.46 crores, showing a modest sequential increase of 4.55% from ₹0.44 crores in Q3 FY26. Nevertheless, this is a significant decline of 36.11% compared to the same quarter last year, highlighting ongoing profitability issues. The operating margin, excluding other income, stood at 33.33%, which is an improvement from 27.78% in the previous quarter but still substantially lower than the 51.81% recorded in Q4 FY25, suggesti...
Read full news article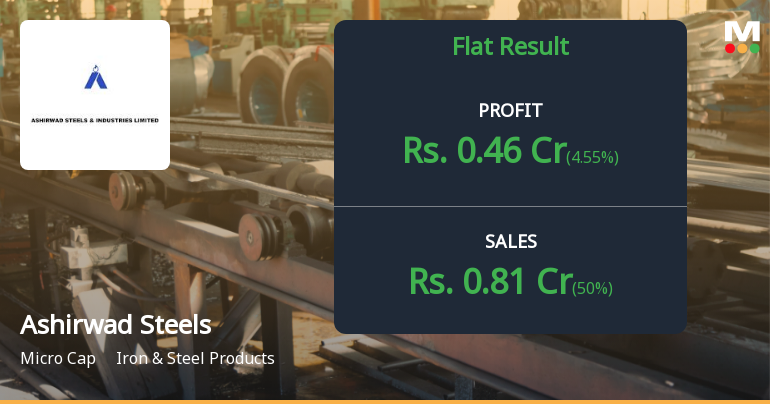
Ashirwad Steels Q4 FY26: Marginal Revenue Recovery Masks Deeper Structural Concerns
Ashirwad Steels & Industries Ltd., the Kolkata-based sponge iron and LPG bottling plant operator, reported a net profit of ₹0.46 crores for Q4 FY26, marking a marginal 4.55% sequential increase from ₹0.44 crores in Q3 FY26 but a concerning 36.11% year-on-year decline from ₹0.72 crores in Q4 FY25. With a diminutive market capitalisation of ₹31.00 crores, the micro-cap company continues to struggle with revenue generation challenges, posting quarterly net sales of merely ₹0.81 crores despite a 50.00% quarter-on-quarter improvement.
Read full news article Announcements
Reg. 34 (1) Annual Report.
25-Jun-2026 | Source : BSE40TH AGM OF THE COMPANY ON 23RD JULY ENCLSOED IS THE NOTICE AND ANNUAL REPORT FOR FY 2025-2026
Intimation Of 40Th Annual General Meeting Book Closure And Submission Of Annual Report For FY 2025-26
24-Jun-2026 | Source : BSE40TH AGM AND THE ANNUAL REPORT FOR THE FY 2025 - 2026 CONTAINING NOTICE
Compliances-Reg.24(A)-Annual Secretarial Compliance
25-May-2026 | Source : BSEsubmission of annual secretarial compliance report for the fy 2025-2026
Corporate Actions

No Upcoming Board Meetings

No Dividend history available

No Splits history available

No Bonus history available

No Rights history available
Quality key factors
Valuation key factors
Technicals key factors
 Technical Indicator Scale: Bearish, Mildly Bearish, Sideways, Mildly Bullish, Bullish Turned
 Shareholding Snapshot : Mar 2026
Shareholding Compare (%holding)
Promoters
None
Held by 1 Schemes (0.07%)
Held by 0 FIIs
Sohini Suppliers Private Limited (18.69%)
Ravi Business Services Pvt. Ltd. (3.3%)
18.72%
Quarterly Results Snapshot (Standalone) - Mar'26 - QoQ

QoQ Growth in quarter ended Mar 2026 is 50.00% vs 12.50% in Dec 2025
QoQ Growth in quarter ended Mar 2026 is 4.55% vs -29.03% in Dec 2025
Half Yearly Results Snapshot (Standalone) - Sep'25

Growth in half year ended Sep 2025 is 39.68% vs 61.54% in Sep 2024
Growth in half year ended Sep 2025 is 0.00% vs 40.51% in Sep 2024
Nine Monthly Results Snapshot (Standalone) - Dec'25
YoY Growth in nine months ended Dec 2025 is 46.39% vs 32.88% in Dec 2024
YoY Growth in nine months ended Dec 2025 is -1.90% vs 16.18% in Dec 2024
Annual Results Snapshot (Standalone) - Mar'26
YoY Growth in year ended Mar 2026 is 15.00% vs 13.21% in Mar 2025
YoY Growth in year ended Mar 2026 is -12.17% vs 1.77% in Mar 2025
About Ashirwad Steels & Industries Ltd

Company Coordinates


