
Compare Asian Energy with Similar Stocks
Dashboard
The company is Net-Debt Free
Poor long term growth as Operating profit has grown by an annual rate 19.49% of over the last 5 years
With a growth in Net Profit of 79.8%, the company declared Very Positive results in Mar 26
With ROE of 12.2, it has a Fair valuation with a 3.2 Price to Book Value
Market Beating performance in long term as well as near term
Total Returns (Price + Dividend) 
Latest dividend: 1.0008644287566633 per share ex-dividend date: Sep-19-2025
Risk Adjusted Returns v/s
Returns Beta

News

Asian Energy Services Ltd Downgraded to Hold Amid Mixed Technical and Valuation Signals
Asian Energy Services Ltd has seen its investment rating downgraded from Buy to Hold as of 3 July 2026, reflecting a nuanced shift in its technical outlook and valuation metrics despite strong financial performance. The company’s mojo score now stands at 67.0, with a micro-cap market classification, signalling a more cautious stance for investors amid evolving market dynamics.
Read full news article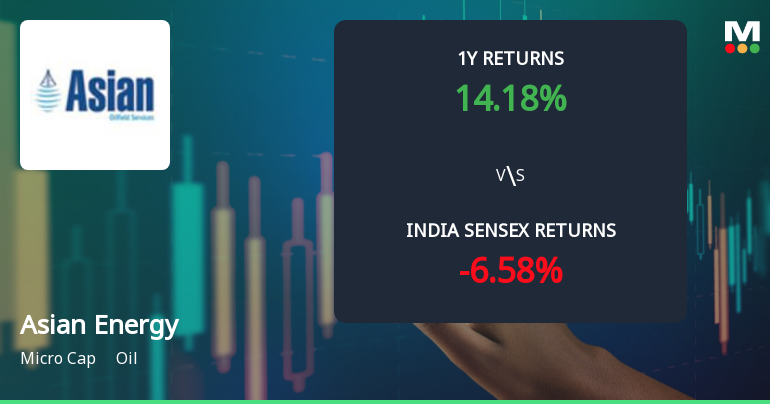
Asian Energy Services Ltd Sees Technical Momentum Shift Amid Mixed Market Signals
Asian Energy Services Ltd, a micro-cap player in the oil sector, has experienced a notable shift in its technical momentum, moving from a bullish to a mildly bullish stance. Despite a recent decline in share price, the stock’s longer-term technical indicators suggest a complex interplay of bullish and bearish signals, warranting a nuanced analysis for investors navigating this evolving landscape.
Read full news article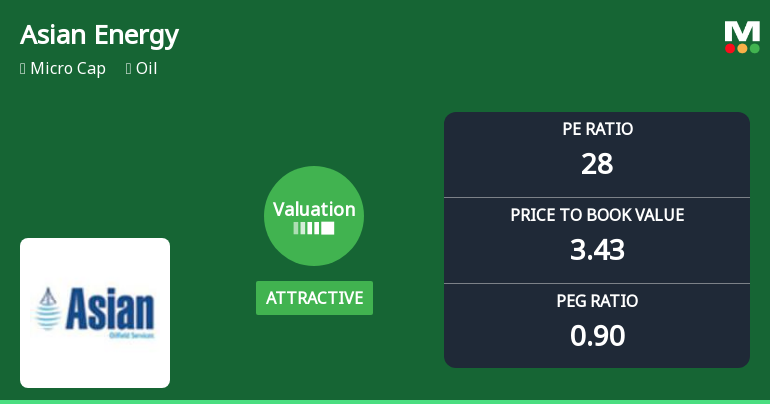
Asian Energy Services Ltd Valuation Shifts to Attractive Amid Strong Market Outperformance
Asian Energy Services Ltd has recently undergone a notable shift in its valuation parameters, moving from a fair to an attractive rating. This change, driven by improvements in key metrics such as the price-to-earnings (P/E) ratio and price-to-book value (P/BV), positions the oil sector micro-cap as a compelling prospect amid a challenging market backdrop.
Read full news article Announcements
Closure of Trading Window
30-Jun-2026 | Source : BSEIntimation of Closure of Trading Window under SEBI (Prohibition of Insider Trading) Regulations 2015
Shareholder Meeting / Postal Ballot-Scrutinizers Report
26-Jun-2026 | Source : BSEDisclosure of Voting Results and Report of the Scrutinizer for Postal Ballot pursuant to Regulation 44 of the SEBI LODR Regulations 2015.
Announcement under Regulation 30 (LODR)-Press Release / Media Release
22-Jun-2026 | Source : BSEPress Release titled Asian Energy Bags Rs. 187.6 Crore Gujarat Power EPC Contract Expands Beyond Coal India.
Corporate Actions

No Upcoming Board Meetings

Asian Energy Services Ltd has declared 10% dividend, ex-date: 19 Sep 25

No Splits history available

No Bonus history available

No Rights history available
Quality key factors
Valuation key factors
Technicals key factors
 Technical Indicator Scale: Bearish, Mildly Bearish, Sideways, Mildly Bullish, Bullish Turned
 Shareholding Snapshot : May 2026
Shareholding Compare (%holding)
Promoters
None
Held by 0 Schemes
Held by 8 FIIs (1.18%)
Oilmax Energy Private Limited (56.03%)
Chartered Finance & Leasing Limited (3.91%)
26.65%
Quarterly Results Snapshot (Consolidated) - Mar'26 - QoQ

QoQ Growth in quarter ended Mar 2026 is 43.65% vs 130.83% in Dec 2025
QoQ Growth in quarter ended Mar 2026 is 83.15% vs 559.21% in Dec 2025
Half Yearly Results Snapshot (Consolidated) - Sep'25
Growth in half year ended Sep 2025 is 37.65% vs 72.58% in Sep 2024
Growth in half year ended Sep 2025 is -84.58% vs 673.23% in Sep 2024
Nine Monthly Results Snapshot (Consolidated) - Dec'25

YoY Growth in nine months ended Dec 2025 is 81.41% vs 33.96% in Dec 2024
YoY Growth in nine months ended Dec 2025 is -2.09% vs 79.91% in Dec 2024
Annual Results Snapshot (Consolidated) - Mar'26
YoY Growth in year ended Mar 2026 is 70.10% vs 52.44% in Mar 2025
YoY Growth in year ended Mar 2026 is 21.46% vs 65.37% in Mar 2025
About Asian Energy Services Ltd

Company Coordinates


