Asian Hotels (N)

  • Market Cap: Micro Cap
  • Industry: Hotels & Resorts
  • ISIN: INE363A01022
  • NSEID: ASIANHOTNR
  • BSEID: 500023
INR
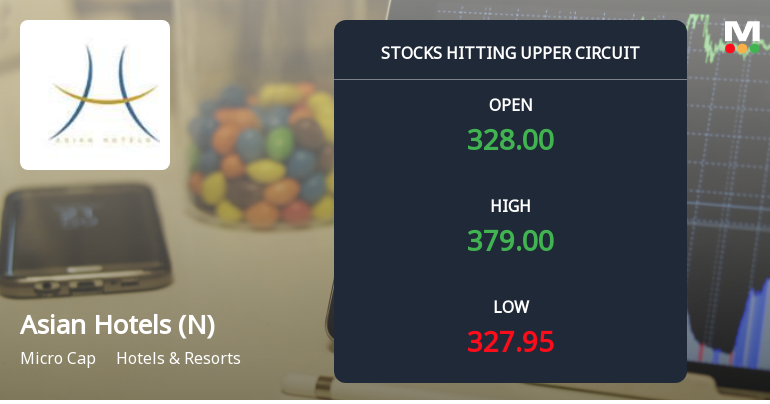
365.20
48.6 (15.35%)
BSENSE

Aug 31, 03:30 PM

BSE+NSE Vol: 10.2 lacs

  • Price Points
  • Score
  • Mojo Parameters
  • Total Return
  • News and Corporate Actions
  • Key factors
  • Shareholding
  • Financials
  • CompanyCV
stock-summaryPrice Point
High/Low

1Day

52 Week

Valuation
Technical
Day's Volume

CASH

10.2 lacs (282.75%) Volume

Shareholding (Jun 2026)

FII

2.58%

Held by 8 FIIs

DII

1.97%

Held by 2 DIIs

Promoter

0.00%

Why is Asian Hotels (North) Ltd falling/rising?

31-Aug-2026

As of 30-Aug, Asian Hotels (North) Ltd's stock price has risen to Rs 316.60, up 2.24%, driven by strong recent performance, positive momentum, and increased investor interest. The stock is trading above key moving averages, indicating bullish sentiment.

As of 30-Aug, Asian Hotels (North) Ltd is experiencing a rise in its stock price, currently at Rs 316.60, which reflects an increase of Rs 6.95 or 2.24%. This upward movement can be attributed to several factors. <BR><BR>Firstly, the stock has shown strong performance over the past four days, gaining a total of 7.56% during this period. Additionally, it has outperformed the sector by 3.7% today. The stock's price has also reached an intraday high of Rs 316.6, indicating positive momentum. <BR><BR>Moreover, Asian Hotels (North) Ltd is trading above its 5-day, 20-day, 50-day, 100-day, and 200-day moving averages, which is generally a bullish signal for investors. There has been a notable increase in investor participation, with delivery volume on 27 August rising by 311% compared to the 5-day average, suggesting heightened interest in the stock. <BR><BR>Overall, these factors contribute to the stock's rising price, reflecting positive investor sentiment and strong trading activity.

View full answer

Should I buy, sell or hold Asian Hotels (North) Ltd?

27-Aug-2026

Who are in the management team of Asian Hotels (N)?

14-Aug-2026

The management team of Asian Hotels (N) includes Amritesh Jatia (Managing Director), Akhilesh Bhuwalka (Director), Ashish Dhanuka (Whole Time Director & CFO), and several Independent Directors: Preeti Gandhi, Mita Jha, and Sanjeev Agarwal, along with Tarun Srivastava (Company Secretary & Compliance Officer).

The management team of Asian Hotels (N) includes the following members:<BR><BR>1. Amritesh Jatia - Managing Director<BR>2. Akhilesh Bhuwalka - Director<BR>3. Preeti Gandhi - Independent Director<BR>4. Ashish Dhanuka - Whole Time Director & CFO<BR>5. Mita Jha - Independent Director<BR>6. Tarun Srivastava - Company Secretary & Compliance Officer<BR>7. Sanjeev Agarwal - Independent Director<BR><BR>If you need more information about any specific member or their roles, feel free to ask!

View full answer

What does Asian Hotels (N) do?

14-Aug-2026

Asian Hotels (North) Ltd operates deluxe hotels under the Hyatt Regency brand in India, with a focus on the Hyatt Regency Delhi since 1982. As of June 2026, it reported net sales of 78 Cr and a net loss of 4 Cr, with a market cap of INR 1,313 Cr.

Overview:<BR>Asian Hotels (North) Ltd is a leading player in the Indian hospitality industry, operating a chain of deluxe category hotels under the Hyatt Regency brand.<BR><BR>History:<BR>The company was incorporated in 1982 and has been operating the Hyatt Regency Delhi, a Five-Star Deluxe Hotel, since its inception. The latest quarterly results reported are for June 2026.<BR><BR>Financial Snapshot:<BR>Net Sales: 78 Cr (Quarterly Results - Jun 2026)<BR>Net Profit: -4 Cr (Quarterly Results - Jun 2026)<BR>Market Cap: INR 1,313 Cr (Micro Cap)<BR><BR>Key Metrics:<BR>P/E: 191.00<BR>Industry P/E: 36<BR>Dividend Yield: 0.00%<BR>Debt-Equity: 3.30<BR>Return on Equity: 7.25%<BR>Price to Book: 7.04<BR><BR>Contact Details:<BR>Address: Bhikaji Cama Place, Mahatma Gandhi Marg New Delhi New Delhi : 110066<BR>Tel: 91-11-66771225/66771226<BR>Email: investorrelations@ahlnorth.com<BR>Website: http://www.asianhotelsnorth.com

View full answer

Who are the peers of the Asian Hotels (N)?

14-Aug-2026

Asian Hotels (N) peers include Oriental Hotels, Brigade Hotel, TajGVK Hotels, EIH Assoc.Hotels, Benares Hotels, Mac Charles(I), Viceroy Hotels, and Royal Orch.Hotel. In terms of management risk, growth, and capital structure, Asian Hotels (N) ranks average among its peers, with a 1-year return of -14.08%.

Peers: The peers of Asian Hotels (N) are Oriental Hotels, Brigade Hotel, TajGVK Hotels, EIH Assoc.Hotels, Benares Hotels, Mac Charles(I), Viceroy Hotels, and Royal Orch.Hotel.<BR><BR>Quality Snapshot: Excellent management risk is observed at TajGVK Hotels, EIH Assoc.Hotels, and Benares Hotels, while Average management risk is found at Brigade Hotel, Asian Hotels (N), and Royal Orch.Hotel, and Below Average management risk is noted at Oriental Hotels, Mac Charles(I), and Viceroy Hotels. For Growth, Excellent growth is seen at TajGVK Hotels and Benares Hotels, Good growth is noted at Oriental Hotels, EIH Assoc.Hotels, Asian Hotels (N), Viceroy Hotels, and Royal Orch.Hotel, while Below Average growth is present at Brigade Hotel and Mac Charles(I). In terms of Capital Structure, Excellent capital structure is found at TajGVK Hotels, EIH Assoc.Hotels, and Benares Hotels, Average capital structure is observed at Oriental Hotels and Brigade Hotel, while Below Average capital structure is noted at Asian Hotels (N), Mac Charles(I), Viceroy Hotels, and Royal Orch.Hotel.<BR><BR>Return Snapshot: The peer with the highest 1-year return is Viceroy Hotels at 25.26%, while Brigade Hotel has the lowest at -28.43%. Asian Hotels (N) has a 1-year return of -14.08%, which is better than Brigade Hotel but worse than Viceroy Hotels. Additionally, the six-month return is negative for EIH Assoc.Hotels, Mac Charles(I), and Royal Orch.Hotel.

View full answer

How big is Asian Hotels (N)?

14-Aug-2026

As of 14th August, Asian Hotels (North) Ltd has a market capitalization of 1,270.68 Cr and reported net sales of 341.81 Cr with a net loss of 41.57 Cr over the latest four quarters.

As of 14th August, <BR><BR>Market Cap: Asian Hotels (North) Ltd has a market capitalization of 1,270.68 Cr, classified as a Micro Cap.<BR><BR>Recent Quarterly Performance: The sum of Net Sales for the latest 4 quarters is 341.81 Cr, while the sum of Net Profit for the same period reflects a loss of 41.57 Cr.<BR><BR>Balance Sheet Snapshot: The latest annual reporting period is March 2022, with Shareholder's Funds amounting to 237.91 Cr and Total Assets valued at 1,517.38 Cr.

View full answer

When is the next results date for Asian Hotels (North) Ltd?

05-Aug-2026

The next results date for Asian Hotels (North) Ltd is 10 August 2026.

The next results date for Asian Hotels (North) Ltd is scheduled for 10 August 2026.

View full answer

Are Asian Hotels (North) Ltd latest results good or bad?

29-May-2026

Asian Hotels (North) Ltd's latest results show strong revenue growth of 72.03%, but profitability is concerning due to a one-time tax credit and a significant decline in net profit. Overall, while revenue recovery is positive, underlying profitability issues and high debt levels suggest caution for investors.

The latest results for Asian Hotels (North) Ltd present a mixed picture. On one hand, the company achieved impressive revenue growth of 72.03% year-on-year, with net sales reaching ₹102.91 crores in Q4 FY26, reflecting a strong recovery in the hospitality sector. This growth is encouraging and indicates a rebound in demand, particularly for its flagship property, Hyatt Regency Delhi.<BR><BR>However, the profitability aspect raises significant concerns. The net profit for the quarter was ₹31.30 crores, but this figure was heavily influenced by a one-time tax credit of ₹33.34 crores, resulting in an unusual tax rate of 1,634.31%. Without this extraordinary benefit, the company would have reported a pre-tax loss of ₹2.04 crores, highlighting the fragility of its underlying business performance. Moreover, the year-on-year comparison shows a drastic decline in net profit of 204.86%, which is alarming.<BR><BR>Additionally, the operating margin decreased to 22.82% from 31.92% a year earlier, indicating rising cost pressures that are eroding profitability gains despite the revenue growth. The company's debt-to-equity ratio of 3.30 times and negative return on equity of -24.23% further underscore structural challenges that could weigh on investor sentiment.<BR><BR>In summary, while the revenue growth is a positive sign, the underlying profitability issues and high leverage present significant risks. Therefore, the overall assessment of the latest results leans towards caution, as the structural challenges appear to outweigh the short-term revenue gains.

View full answer

Is Asian Hotels (N) technically bullish or bearish?

19-Nov-2025

As of November 18, 2025, Asian Hotels (N) exhibits a mildly bearish trend, influenced by bearish weekly MACD and daily moving averages, while mixed signals from Bollinger Bands and KST suggest weak bearish sentiment in the short term.

As of 18 November 2025, the technical trend for Asian Hotels (N) has changed from sideways to mildly bearish. The current stance is mildly bearish, primarily driven by the weekly MACD indicating a bearish trend and the daily moving averages also reflecting a mildly bearish position. The monthly RSI is bearish, while the Bollinger Bands show a mixed signal with mildly bearish on the weekly and mildly bullish on the monthly. The KST indicates a mildly bullish trend on the weekly and bullish on the monthly, but this is countered by the OBV showing a mildly bearish stance on the weekly. Overall, the indicators suggest a weak bearish sentiment in the short term with some mixed signals in the longer term.

View full answer

How has been the historical performance of Asian Hotels (N)?

15-Nov-2025

Asian Hotels (N) has experienced significant fluctuations in financial performance, with net sales rising to 130.53 Cr in March 2022 from 72.58 Cr in March 2021, but still down from 252.39 Cr in March 2020. Despite a recovery in operating profit, the company reported a net loss of -425.37 Cr in March 2022, indicating ongoing challenges.

Answer:<BR>The historical performance of Asian Hotels (N) shows significant fluctuations in key financial metrics over the years.<BR><BR>Breakdown:<BR>Asian Hotels (N) reported net sales of 130.53 Cr in March 2022, a notable increase from 72.58 Cr in March 2021, but a decline from 252.39 Cr in March 2020. The total operating income mirrored this trend, rising to 130.53 Cr in March 2022 from 72.58 Cr in the previous year, yet still down from 252.39 Cr in March 2020. The total expenditure, excluding depreciation, was 124.71 Cr in March 2022, up from 95.19 Cr in March 2021, leading to an operating profit (PBDIT) of 10.07 Cr, a recovery from a loss of 17.93 Cr in March 2021. However, the company faced substantial interest expenses of 109.79 Cr, resulting in a profit before tax of -453.83 Cr in March 2022, an improvement from -694.97 Cr in March 2021. The net profit also showed a slight recovery, standing at -425.37 Cr in March 2022 compared to -694.26 Cr in March 2021. Total assets decreased to 1,517.38 Cr in March 2022 from 1,964.72 Cr in March 2021, while total liabilities also fell to 1,517.38 Cr from 1,964.72 Cr. The cash flow from operating activities was 14.00 Cr in March 2022, down from 40.00 Cr in March 2021, with a closing cash equivalent of 1.00 Cr remaining unchanged from the previous year. Overall, the financial performance indicates a challenging recovery phase for Asian Hotels (N) amidst fluctuating revenues and persistent losses.

View full answer

Is Asian Hotels (N) overvalued or undervalued?

15-Sep-2025

As of September 12, 2025, Asian Hotels (N) is considered undervalued with a valuation grade upgrade to attractive, highlighted by a PE ratio of -7.45 and a 1-year return of 84.36%, contrasting sharply with its expensive peers like Indian Hotels Co and ITC Hotels.

As of 12 September 2025, the valuation grade for Asian Hotels (N) has moved from risky to attractive, indicating a significant improvement in its perceived value. The company is currently considered undervalued. Key ratios highlight this position: the Price to Earnings (PE) ratio stands at -7.45, the EV to EBITDA ratio is 13.16, and the Return on Capital Employed (ROCE) is at 7.44%. <BR><BR>In comparison to its peers, Asian Hotels (N) shows a stark contrast with Indian Hotels Co, which has a PE ratio of 64.95 and an EV to EBITDA of 38.23, and ITC Hotels, with a PE of 73.77 and an EV to EBITDA of 42.12, both classified as very expensive. Despite recent stock performance lagging behind the Sensex over the past week and month, Asian Hotels (N) has demonstrated strong returns over the longer term, with a 1-year return of 84.36% compared to the Sensex's -1.28%. This performance further supports the undervaluation narrative.

View full answer

Who are the top shareholders of the Asian Hotels (N)?

17-Jul-2025

The top shareholder of Asian Hotels (N) is Narendrakumar Ramesh Chandra Raval, holding 24.3% of the shares, while individual investors collectively own 21.96%. Foreign institutional investors hold 5.26%, and mutual funds have no significant holdings.

The top shareholders of Asian Hotels (N) include individual investors, with the highest public shareholder being Narendrakumar Ramesh Chandra Raval, who holds 24.3% of the shares. Additionally, individual investors collectively hold 21.96% of the company's shares. The company also has some foreign institutional investors (FIIs) holding 5.26% of the shares, while mutual funds have a negligible presence with 0.0% held by seven schemes. There are no pledged promoter holdings, and there is no single promoter with the highest holding.

View full answer

Has Asian Hotels (N) declared dividend?

06-Jun-2025

Asian Hotels (North) Ltd has declared a 10% dividend, amounting to ₹1 per share, with an ex-date of September 25, 2014. However, the dividend yield is 0%, as total returns have been driven solely by price appreciation, showing significant gains over various periods.

Asian Hotels (North) Ltd has declared a 10% dividend.<BR><BR>Dividend Details:<BR>- Percentage announced: 10%<BR>- Amount per share: 1<BR>- Ex-date: 25 Sep 14<BR><BR>Dividend Yield: 0%<BR><BR>Total Returns by Period:<BR>In the 6-month period, the price return was 59.5%, the dividend return was 0%, resulting in a total return of 59.5%.<BR><BR>For the 1-year period, the price return was 155.14%, the dividend return was 0%, leading to a total return of 155.14%.<BR><BR>Over the 2-year period, the price return was 81.82%, with a dividend return of 0%, culminating in a total return of 81.82%.<BR><BR>In the 3-year period, the price return was 355.7%, the dividend return was 0%, which resulted in a total return of 355.7%.<BR><BR>For the 4-year period, the price return was 262.36%, with a dividend return of 0%, giving a total return of 262.36%.<BR><BR>In the 5-year period, the price return was 542.28%, the dividend return was 0%, resulting in a total return of 542.28%.<BR><BR>Overall, while Asian Hotels (North) Ltd has declared a dividend, the dividend yield remains at 0%, indicating that the returns have primarily come from price appreciation rather than dividends. The total returns over various periods reflect significant price increases, highlighting strong performance in the stock.

View full answer
iScoreScore
Click here to find our call on this stock
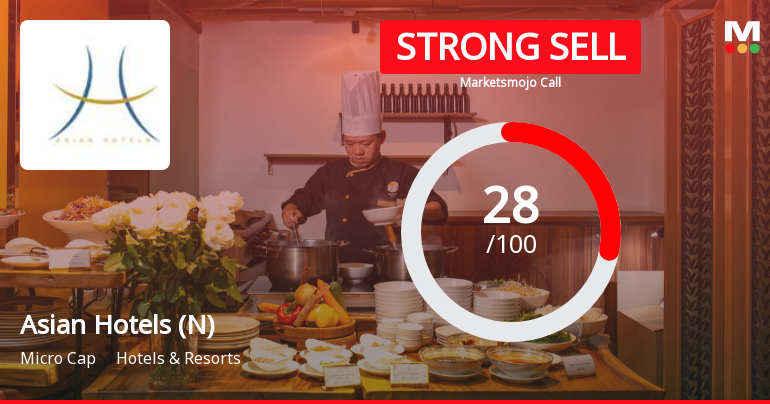
Strong Sell
Sell
Hold
Buy
Strong Buy

Dashboard

1

High Debt company with Weak Long Term Fundamental Strength

  • High Debt Company with a Debt to Equity ratio (avg) of 5.87 times
  • The company has been able to generate a Return on Equity (avg) of 0.37% signifying low profitability per unit of shareholders funds
2

With ROCE of 3.4, it has a Expensive valuation with a 2.5 Enterprise value to Capital Employed

3

Despite the size of the company, domestic mutual funds hold only 0% of the company

stock-summaryMojo Parameters

Mojo Parameters

Loading Valuation Snapshot...

Stock DNA

stock-summary
Industry

Hotels & Resorts

stock-summary
Market cap

INR 1,366 Cr (Micro Cap)

stock-summary
P/E

229.00

stock-summary
Industry P/E

36

stock-summary
Dividend Yield

0.00%

stock-summary
Debt Equity

3.30

stock-summary
Return on Equity

7.25%

stock-summary
Price to Book

7.29

Revenue and Profits:
Net Sales:
78 Cr
(Quarterly Results - Jun 2026)
Net Profit:
-4 Cr
stock-summaryTotal Returns
Total Returns (Price + Dividend) stock-summary
Dividend Yield (0%)
TimePeriod
Price Return
Dividend Return
Total Return
3 Months
15.44%
0%
15.44%
6 Months
30.83%
0%
30.83%
1 Year
10.97%
0%
10.97%
2 Years
97.67%
0%
97.67%
3 Years
141.77%
0%
141.77%
4 Years
311.03%
0%
311.03%
5 Years
363.75%
0%
363.75%

Latest dividend: 1 per share ex-dividend date: Sep-25-2014

Risk Adjusted Returns v/s stock-summary
Returns Beta
Icon
Beta has not been calculated since enough price history is not available
stock-summaryNews & Corporate Actions

News

Asian Hotels (North) Ltd Gains 7.03%: 3 Key Factors Driving the Move

Announcements stock-summary

Announcement under Regulation 30 (LODR)-Newspaper Publication

26-Aug-2026 | Source : BSE

Submission of Newspaper publication in Business Standard daily English and Hindi both dated 26.08.2026 regarding Notice to the Members for registering/updating their e-mail address.

Announcement under Regulation 30 (LODR)-Change in Management

25-Aug-2026 | Source : BSE

Intimation under Regulation 30 of SEBI (LODR) regarding appointment of Ms. Gauri Dhawan as Head of Marketing PR and Branding one of the Senior Management Personnel of the Company w.e.f. September 01 2026 attached.

Announcement under Regulation 30 (LODR)-Newspaper Publication

11-Aug-2026 | Source : BSE

Submission of Newspaper Publication of Un-audited Standalone and Consolidated Financial Results for the quarter ended 30.06.2026.

Corporate Actions stock-summary

stock-summary
BOARD MEETING

No Upcoming Board Meetings

stock-summary
DIVIDEND

Asian Hotels (North) Ltd has declared 10% dividend, ex-date: 25 Sep 14

stock-summary
SPLITS

No Splits history available

stock-summary
BONUS

No Bonus history available

stock-summary
RIGHTS

No Rights history available

stock-summaryKey Factors

Quality key factors stock-summary

Factor
Value
Sales Growth (5y)
35.02%
EBIT Growth (5y)
22.34%
EBIT to Interest (avg)
0.31
Debt to EBITDA (avg)
7.16
Net Debt to Equity (avg)
3.30
Sales to Capital Employed (avg)
0.22
Tax Ratio
33.47%
Dividend Payout Ratio
0
Pledged Shares
0
Institutional Holding
4.55%
ROCE (avg)
2.42%
ROE (avg)
0.37%

Valuation key factors

Factor
Value
P/E Ratio
229
Industry P/E
36
Price to Book Value
8.22
EV to EBIT
80.84
EV to EBITDA
48.53
EV to Capital Employed
2.68
EV to Sales
6.12
PEG Ratio
1.06
Dividend Yield
NA
ROCE (Latest)
3.44%
ROE (Latest)
7.25%

Technicals key factors

Indicator
Weekly
Monthly
MACD
Bullish
Mildly Bearish
RSI
No Signal
No Signal
Bollinger Bands
Bullish
Bullish
Moving Averages
Mildly Bearish (Daily)
KST
Bullish
Mildly Bearish
Dow Theory
Mildly Bullish
No Trend
OBV
No Trend
Bullish
stock-summary Technical Indicator Scale: Bearish, Mildly Bearish, Sideways, Mildly Bullish, Bullish  Turned 
stock-summaryShareholding
Shareholding Snapshot : Jun 2026stock-summary
Shareholding Compare (%holding) stock-summary
Majority shareholders

Non Institution

Pledged Promoter Holdings

None

Mutual Funds

Held by 7 Schemes (0.0%)

FIIs

Held by 8 FIIs (2.58%)

Promoter with highest holding

None

Highest Public shareholder

Elana Holdings Pte Ltd. (54.37%)

Individual Investors Holdings

9.03%

stock-summaryFinancial
[
  {
    "link": "quarterly",
    "btn_text": "All Quarterly Results",
    "header": "Quarterly Results Snapshot (Standalone) - Jun'26 - QoQ",
    "rhs": [
      {
        "prefix": "Net Sales ",
        "suffix": "QoQ Growth in quarter ended Jun 2026 is -24.57% vs 13.11% in Mar 2026",
        "dir": -1
      },
      {
        "prefix": "Standalone Net Profit ",
        "suffix": "QoQ Growth in quarter ended Jun 2026 is -111.06% vs 156.67% in Mar 2026",
        "dir": -1
      }
    ],
    "table": {
      "header": [
        "Jun'26",
        "Mar'26",
        "Change(%)"
      ],
      "body": [
        {
          "field": "Net Sales",
          "val1": "77.63",
          "val2": "102.91",
          "chgp": "-24.57%",
          "chgp_class": "negative"
        },
        {
          "field": "Operating Profit (PBDIT) excl Other Income",
          "val1": "13.56",
          "val2": "23.48",
          "chgp": "-42.25%",
          "chgp_class": "negative"
        },
        {
          "field": "Interest",
          "val1": "14.12",
          "val2": "14.10",
          "chgp": "0.14%",
          "chgp_class": "negative"
        },
        {
          "field": "Exceptional Items",
          "val1": "0.00",
          "val2": "-7.95",
          "chgp": "100.00%",
          "chgp_class": "positive"
        },
        {
          "field": "Standalone Net Profit",
          "val1": "-3.54",
          "val2": "32.00",
          "chgp": "-111.06%",
          "chgp_class": "negative"
        },
        {
          "field": "Operating Profit Margin (Excl OI)",
          "val1": "17.47%",
          "val2": "22.82%",
          "chgp": "-5.35%",
          "chgp_class": "negative"
        }
      ]
    }
  },
  {
    "link": "half-yearly",
    "btn_text": "All Half Yearly Results",
    "header": "Half Yearly Results Snapshot (Standalone) - Sep'25",
    "rhs": [
      {
        "prefix": "Net Sales ",
        "suffix": " Growth in half year ended Sep 2025 is 4.97% vs 1.80% in Sep 2024",
        "dir": 1
      },
      {
        "prefix": "Standalone Net Profit ",
        "suffix": " Growth in half year ended Sep 2025 is 0.19% vs -79.02% in Sep 2024",
        "dir": 1
      }
    ],
    "table": {
      "header": [
        "Sep'25",
        "Sep'24",
        "Change(%)"
      ],
      "body": [
        {
          "field": "Net Sales",
          "val1": "147.19",
          "val2": "140.22",
          "chgp": "4.97%",
          "chgp_class": "positive"
        },
        {
          "field": "Operating Profit (PBDIT) excl Other Income",
          "val1": "12.21",
          "val2": "33.25",
          "chgp": "-63.28%",
          "chgp_class": "negative"
        },
        {
          "field": "Interest",
          "val1": "37.12",
          "val2": "72.41",
          "chgp": "-48.74%",
          "chgp_class": "positive"
        },
        {
          "field": "Exceptional Items",
          "val1": "-56.74",
          "val2": "0.00",
          "chgp": "",
          "chgp_class": "neutral"
        },
        {
          "field": "Standalone Net Profit",
          "val1": "-77.08",
          "val2": "-77.23",
          "chgp": "0.19%",
          "chgp_class": "positive"
        },
        {
          "field": "Operating Profit Margin (Excl OI)",
          "val1": "8.30%",
          "val2": "23.71%",
          "chgp": "-15.41%",
          "chgp_class": "negative"
        }
      ]
    }
  },
  {
    "link": "nine-monthly",
    "btn_text": "All Nine Monthly Results",
    "header": "Nine Monthly Results Snapshot (Standalone) - Dec'25",
    "rhs": [
      {
        "prefix": "Net Sales ",
        "suffix": "YoY Growth in nine months ended Dec 2025 is 5.06% vs 5.68% in Dec 2024",
        "dir": -1
      },
      {
        "prefix": "Standalone Net Profit ",
        "suffix": "YoY Growth in nine months ended Dec 2025 is -1,121.81% vs 118.08% in Dec 2024",
        "dir": -1
      }
    ],
    "table": {
      "header": [
        "Dec'25",
        "Dec'24",
        "Change(%)"
      ],
      "body": [
        {
          "field": "Net Sales",
          "val1": "238.17",
          "val2": "226.69",
          "chgp": "5.06%",
          "chgp_class": "positive"
        },
        {
          "field": "Operating Profit (PBDIT) excl Other Income",
          "val1": "21.78",
          "val2": "54.76",
          "chgp": "-60.23%",
          "chgp_class": "negative"
        },
        {
          "field": "Interest",
          "val1": "58.37",
          "val2": "101.00",
          "chgp": "-42.21%",
          "chgp_class": "positive"
        },
        {
          "field": "Exceptional Items",
          "val1": "-97.02",
          "val2": "116.54",
          "chgp": "-183.25%",
          "chgp_class": "negative"
        },
        {
          "field": "Standalone Net Profit",
          "val1": "-133.55",
          "val2": "13.07",
          "chgp": "-1,121.81%",
          "chgp_class": "negative"
        },
        {
          "field": "Operating Profit Margin (Excl OI)",
          "val1": "9.14%",
          "val2": "24.16%",
          "chgp": "-15.02%",
          "chgp_class": "negative"
        }
      ]
    }
  },
  {
    "link": "annual",
    "btn_text": "All Annual Results",
    "header": "Annual Results Snapshot (Consolidated) - Mar'26",
    "rhs": [
      {
        "prefix": "Net Sales ",
        "suffix": "YoY Growth in year ended Mar 2026 is 7.19% vs 143.77% in Mar 2025",
        "dir": -1
      },
      {
        "prefix": "Consolidated Net Profit ",
        "suffix": "YoY Growth in year ended Mar 2026 is -154.23% vs 144.02% in Mar 2025",
        "dir": -1
      }
    ],
    "table": {
      "header": [
        "Mar'26",
        "Mar'25",
        "Change(%)"
      ],
      "body": [
        {
          "field": "Net Sales",
          "val1": "341.08",
          "val2": "318.19",
          "chgp": "7.19%",
          "chgp_class": "positive"
        },
        {
          "field": "Operating Profit (PBDIT) excl Other Income",
          "val1": "45.25",
          "val2": "83.95",
          "chgp": "-46.10%",
          "chgp_class": "negative"
        },
        {
          "field": "Interest",
          "val1": "72.47",
          "val2": "133.63",
          "chgp": "-45.77%",
          "chgp_class": "positive"
        },
        {
          "field": "Exceptional Items",
          "val1": "-104.96",
          "val2": "301.21",
          "chgp": "-134.85%",
          "chgp_class": "negative"
        },
        {
          "field": "Consolidate Net Profit",
          "val1": "-101.56",
          "val2": "187.26",
          "chgp": "-154.23%",
          "chgp_class": "negative"
        },
        {
          "field": "Operating Profit Margin (Excl OI)",
          "val1": "13.27%",
          "val2": "26.38%",
          "chgp": "-13.11%",
          "chgp_class": "negative"
        }
      ]
    }
  }
]

Quarterly Results Snapshot (Standalone) - Jun'26 - QoQstock-summary

Jun'26
Mar'26
Change(%)
Net Sales
77.63
102.91
-24.57%
Operating Profit (PBDIT) excl Other Income
13.56
23.48
-42.25%
Interest
14.12
14.10
0.14%
Exceptional Items
0.00
-7.95
100.00%
Standalone Net Profit
-3.54
32.00
-111.06%
Operating Profit Margin (Excl OI)
17.47%
22.82%
-5.35%
Values in Rs Cr.
Direction Arrows
Net Sales

QoQ Growth in quarter ended Jun 2026 is -24.57% vs 13.11% in Mar 2026

Direction Arrows
Standalone Net Profit

QoQ Growth in quarter ended Jun 2026 is -111.06% vs 156.67% in Mar 2026

Half Yearly Results Snapshot (Standalone) - Sep'25stock-summary

Sep'25
Sep'24
Change(%)
Net Sales
147.19
140.22
4.97%
Operating Profit (PBDIT) excl Other Income
12.21
33.25
-63.28%
Interest
37.12
72.41
-48.74%
Exceptional Items
-56.74
0.00
Standalone Net Profit
-77.08
-77.23
0.19%
Operating Profit Margin (Excl OI)
8.30%
23.71%
-15.41%
Values in Rs Cr.
Direction Arrows
Net Sales

Growth in half year ended Sep 2025 is 4.97% vs 1.80% in Sep 2024

Direction Arrows
Standalone Net Profit

Growth in half year ended Sep 2025 is 0.19% vs -79.02% in Sep 2024

Nine Monthly Results Snapshot (Standalone) - Dec'25stock-summary

Dec'25
Dec'24
Change(%)
Net Sales
238.17
226.69
5.06%
Operating Profit (PBDIT) excl Other Income
21.78
54.76
-60.23%
Interest
58.37
101.00
-42.21%
Exceptional Items
-97.02
116.54
-183.25%
Standalone Net Profit
-133.55
13.07
-1,121.81%
Operating Profit Margin (Excl OI)
9.14%
24.16%
-15.02%
Values in Rs Cr.
Direction Arrows
Net Sales

YoY Growth in nine months ended Dec 2025 is 5.06% vs 5.68% in Dec 2024

Direction Arrows
Standalone Net Profit

YoY Growth in nine months ended Dec 2025 is -1,121.81% vs 118.08% in Dec 2024

Annual Results Snapshot (Consolidated) - Mar'26stock-summary

Mar'26
Mar'25
Change(%)
Net Sales
341.08
318.19
7.19%
Operating Profit (PBDIT) excl Other Income
45.25
83.95
-46.10%
Interest
72.47
133.63
-45.77%
Exceptional Items
-104.96
301.21
-134.85%
Consolidate Net Profit
-101.56
187.26
-154.23%
Operating Profit Margin (Excl OI)
13.27%
26.38%
-13.11%
Values in Rs Cr.
Direction Arrows
Net Sales

YoY Growth in year ended Mar 2026 is 7.19% vs 143.77% in Mar 2025

Direction Arrows
Consolidated Net Profit

YoY Growth in year ended Mar 2026 is -154.23% vs 144.02% in Mar 2025

stock-summaryCompany CV
About Asian Hotels (North) Ltd stock-summary
stock-summary
Asian Hotels (North) Ltd
Micro Cap
Hotels & Resorts
Asian Hotels (North) Limited is one of the leading player in the Indian hospitality industry operating a chain of deluxe category hotels under the brand Hyatt Regency Hotels since 1982. The Company presently operates one Five-Star Deluxe Hotel in Delhi with the name Hyatt Regency Delhi. Hyatt Regency New Delhi is located at Bhikaji Cama Place and is a 5-Star Deluxe Hotel, which has been operating since 1982.
Company Coordinates stock-summary
Company Details
Bhikaji Cama Place, Mahatma Gandhi Marg New Delhi New Delhi : 110066
stock-summary
Tel: 91-11-66771225/66771226
stock-summary
investorrelations@ahlnorth.com
Registrar Details
Karvy Computershare Pvt Ltd, Plot No 17-24 , Near Image Hospital,, Reliance Cybervilae,Vithalrao Nagar,, Madhapur, Hyderabad