
Compare Athena Global with Similar Stocks
Dashboard
With a Operating Losses, the company has a Weak Long Term Fundamental Strength
- Poor long term growth as Net Sales has grown by an annual rate of -15.54% and Operating profit at -207.29% over the last 5 years
- Low ability to service debt as the company has a high Debt to EBITDA ratio of -10.11 times
The company has declared Negative results for the last 3 consecutive quarters
Risky - Negative EBITDA
Below par performance in long term as well as near term
Stock DNA
Computers - Software & Consulting
INR 77 Cr (Micro Cap)
NA (Loss Making)
20
0.00%
0.84
-11.44%
0.54
Total Returns (Price + Dividend) 
Athena Global for the last several years.
Risk Adjusted Returns v/s
Returns Beta

News

Athena Global Technologies Ltd is Rated Strong Sell
Athena Global Technologies Ltd is rated Strong Sell by MarketsMOJO. This rating was last updated on 22 September 2025. However, the analysis and financial metrics discussed below reflect the stock's current position as of 09 July 2026, providing investors with an up-to-date view of the company’s fundamentals, returns, and overall outlook.
Read full news article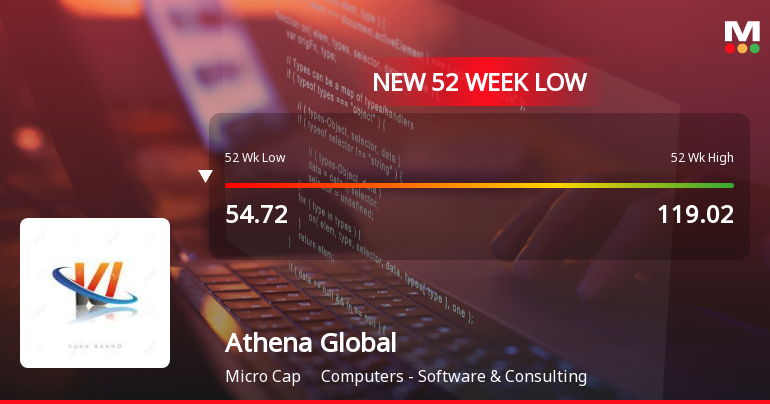
Athena Global Technologies Ltd Falls to 52-Week Low of Rs 54.72 as Sell-Off Deepens
For the fourth consecutive session, Athena Global Technologies Ltd has declined, culminating in a fresh 52-week low of Rs 54.72 on 7 Jul 2026. This marks a significant 54% drop from its 52-week high of Rs 119.02, underscoring persistent selling pressure despite a broadly resilient market backdrop.
Read full news article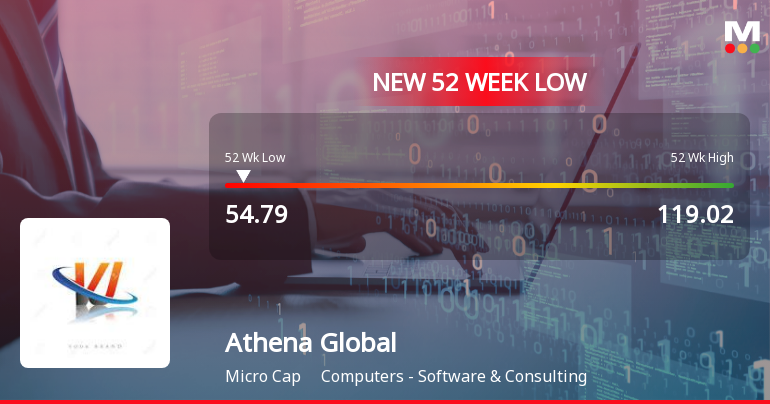
Announcements
Compliances-Certificate under Reg. 74 (5) of SEBI (DP) Regulations 2018
07-Jul-2026 | Source : BSECertificate under Regulation 74(5) of SEBI (Depositories and Participants ) Regulation 2018 for the first quarter ended June 30 2026.
Closure of Trading Window
26-Jun-2026 | Source : BSEThe Trading Window for the transactions in the shares of the company for all the designated person and their immediate relative will continue to remain close from 01st July 2026 till 48 hours after the declaration of financial results for the first quarter ended 30th June 2026.
Board Meeting Outcome for Outcome Of The Board Meeting
31-May-2026 | Source : BSEOutcome of the Board Meeting
Corporate Actions

No Upcoming Board Meetings

No Dividend history available

No Splits history available

No Bonus history available

No Rights history available
Quality key factors
Valuation key factors
Technicals key factors
 Technical Indicator Scale: Bearish, Mildly Bearish, Sideways, Mildly Bullish, Bullish Turned
 Shareholding Snapshot : Mar 2026
Shareholding Compare (%holding)
Promoters
None
Held by 0 Schemes
Held by 0 FIIs
M Satyendra (47.52%)
Garima Vashistha (2.61%)
26.06%
Quarterly Results Snapshot (Consolidated) - Mar'26 - QoQ

QoQ Growth in quarter ended Mar 2026 is 53.85% vs -14.01% in Dec 2025

QoQ Growth in quarter ended Mar 2026 is -3,267.54% vs 117.90% in Dec 2025
Half Yearly Results Snapshot (Consolidated) - Sep'25
Growth in half year ended Sep 2025 is -34.54% vs 44.75% in Sep 2024
Growth in half year ended Sep 2025 is -13.57% vs 16.47% in Sep 2024
Nine Monthly Results Snapshot (Consolidated) - Dec'25
YoY Growth in nine months ended Dec 2025 is -38.73% vs 29.11% in Dec 2024
YoY Growth in nine months ended Dec 2025 is 27.88% vs 14.39% in Dec 2024
Annual Results Snapshot (Consolidated) - Mar'26
YoY Growth in year ended Mar 2026 is -28.30% vs 13.35% in Mar 2025
YoY Growth in year ended Mar 2026 is -126.37% vs -109.82% in Mar 2025
About Athena Global Technologies Ltd

Company Coordinates


