
Compare Atlas Cycles with Similar Stocks
Dashboard
With a Operating Losses, the company has a Weak Long Term Fundamental Strength
- Poor long term growth as Net Sales has grown by an annual rate of -59.70% and Operating profit at -207.12% over the last 5 years
- Company's ability to service its debt is weak with a poor EBIT to Interest (avg) ratio of -7.02
Negative results in Mar 26
Risky - Negative EBITDA
Underperformed the market in the last 1 year
Stock DNA
Diversified consumer products
INR 67 Cr (Micro Cap)
NA (Loss Making)
32
0.00%
0.02
-2.12%
0.17
Total Returns (Price + Dividend) 
Latest dividend: 2.2500 per share ex-dividend date: Sep-19-2013
Risk Adjusted Returns v/s
Returns Beta

News
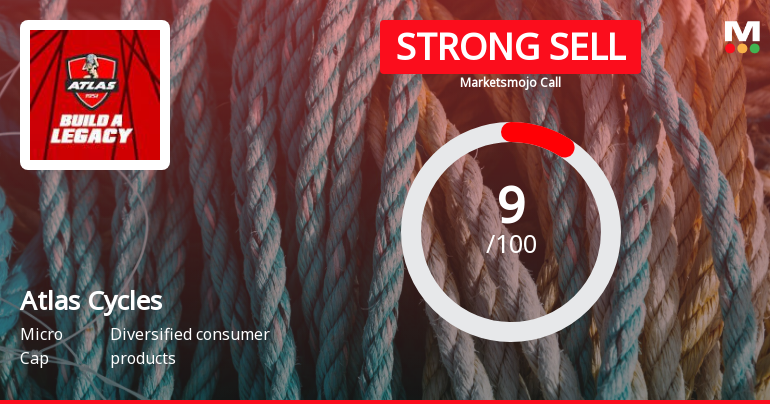
Atlas Cycles (Haryana) Ltd is Rated Strong Sell
Atlas Cycles (Haryana) Ltd is rated Strong Sell by MarketsMOJO. This rating was last updated on 20 Apr 2026. However, all fundamentals, returns, and financial metrics discussed below reflect the stock’s current position as of 26 May 2026, providing investors with the latest comprehensive view of the company’s performance and outlook.
Read full news article
Atlas Cycles (Haryana) Ltd is Rated Strong Sell
Atlas Cycles (Haryana) Ltd is rated Strong Sell by MarketsMOJO. This rating was last updated on 20 Apr 2026. However, all fundamentals, returns, and financial metrics discussed here reflect the company’s current position as of 15 May 2026, providing investors with the latest insights into the stock’s performance and outlook.
Read full news article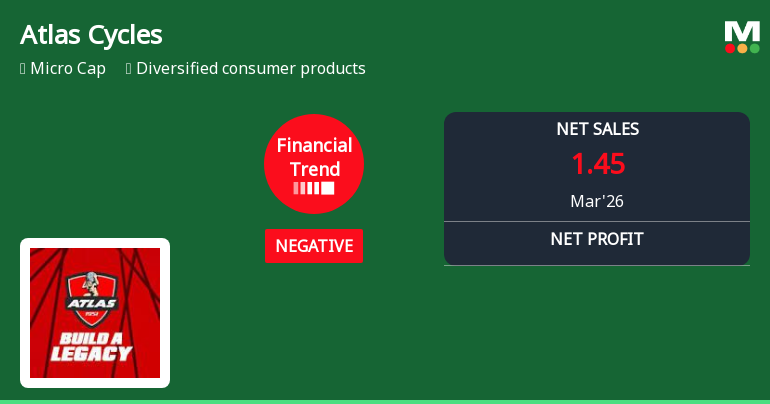
Atlas Cycles (Haryana) Ltd Reports Sharp Quarterly Decline Amid Negative Financial Trend
Atlas Cycles (Haryana) Ltd has reported a significant deterioration in its financial performance for the quarter ended March 2026, with key profitability metrics plunging sharply and the company’s financial trend shifting from flat to negative. This downturn comes despite a modest uptick in the stock price, reflecting growing investor concerns amid a challenging operating environment for the diversified consumer products firm.
Read full news article Announcements
Atlas Cycles (Haryana) Limited - Reply to Clarification- Financial results
09-Dec-2019 | Source : NSEAtlas Cycles (Haryana) Limitedlas Cycles (Haryana) Limited for the quarter ended 30-Jun-2019 with respect to Regulation 33 of the SEBI (Listing Obligations and Disclosure Requirements) Regulations, 2015.
Atlas Cycles (Haryana) Limited - Clarification - Financial Results
05-Dec-2019 | Source : NSEAtlas Cycles (Haryana) Limitedes (Haryana) Limited for the quarter ended 30-Jun-2019 with respect to Regulation 33 of the SEBI (Listing Obligations and Disclosure Requirements) Regulations, 2015.
Atlas Cycles (Haryana) Limited - Clarification - Financial Results
03-Dec-2019 | Source : NSEAtlas Cycles (Haryana) Limitedes (Haryana) Limited for the quarter ended 30-Sep-2019 with respect to Regulation 33 of the SEBI (Listing Obligations and Disclosure Requirements) Regulations, 2015.
Corporate Actions

No Upcoming Board Meetings

Atlas Cycles (Haryana) Ltd has declared 45% dividend, ex-date: 19 Sep 13

Atlas Cycles (Haryana) Ltd has announced 5:10 stock split, ex-date: 30 Oct 17

No Bonus history available

No Rights history available
Quality key factors
Valuation key factors
Technicals key factors
 Technical Indicator Scale: Bearish, Mildly Bearish, Sideways, Mildly Bullish, Bullish Turned
 Shareholding Snapshot : Mar 2026
Shareholding Compare (%holding)
Non Institution
None
Held by 0 Schemes
Held by 0 FIIs
Milton Cycle Industries Ltd. (14.85%)
Ramesh Chand (1.36%)
50.31%
Quarterly Results Snapshot (Standalone) - Mar'26 - YoY

YoY Growth in quarter ended Mar 2026 is -60.49% vs 11.21% in Mar 2025
YoY Growth in quarter ended Mar 2026 is -361.22% vs -85.22% in Mar 2025
Half Yearly Results Snapshot (Standalone) - Sep'25
Not Applicable: The company has declared_date for only one period
Not Applicable: The company has declared_date for only one period
Nine Monthly Results Snapshot (Standalone) - Dec'25
Not Applicable: The company has declared_date for only one period
Not Applicable: The company has declared_date for only one period
Annual Results Snapshot (Standalone) - Mar'26
YoY Growth in year ended Mar 2026 is -59.74% vs 169.50% in Mar 2025
YoY Growth in year ended Mar 2026 is -184.54% vs 1,661.11% in Mar 2025
About Atlas Cycles (Haryana) Ltd

Company Coordinates


