
Compare Atmos Energy Corp. with Similar Stocks
Total Returns (Price + Dividend) 
Atmos Energy Corp. for the last several years.
Risk Adjusted Returns v/s
News
Is Atmos Energy Corp. overvalued or undervalued?
As of 21 November 2025, the valuation grade for Atmos Energy Corp. has moved from expensive to fair. The company appears to be fairly valued based on its current metrics. Key ratios include a P/E ratio of 21, an EV to EBITDA of 14.60, and a Price to Book Value of 1.84. In comparison, Targa Resources Corp. has a P/E of 17.82 and an EV to EBITDA of 11.06, while Cheniere Energy Partners LP shows a more attractive P/E of 15.72 and an EV to EBITDA of 11.33. Despite a recent dip in stock performance, Atmos Energy Corp. has outperformed the S&P 500 year-to-date with a return of 25.34% compared to the S&P 500's 12.26%. However, over longer periods, the company's returns lag behind the benchmark, particularly in the 3-year and 5-year comparisons. This suggests that while the stock is currently fairly valued, it may face challenges in maintaining competitive returns in the long run....
Read full news article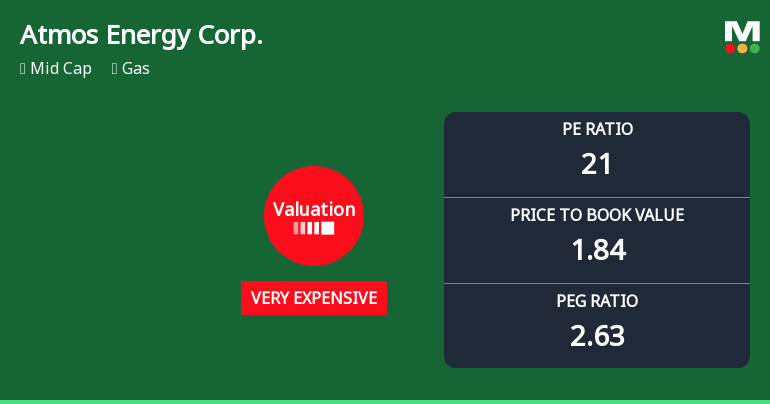
Atmos Energy Corp. Experiences Valuation Adjustment Amid Competitive Gas Industry Landscape
Atmos Energy Corp. has recently adjusted its valuation, with a current P/E ratio of 21 and a price-to-book value of 1.84. The company has outperformed the S&P 500 in year-to-date and annual returns, though it has lagged in longer-term performance compared to the broader market.
Read full news articleIs Atmos Energy Corp. overvalued or undervalued?
As of 21 November 2025, the valuation grade for Atmos Energy Corp. has moved from expensive to fair. The company appears fairly valued based on its current metrics. Key ratios include a P/E ratio of 21, an EV to EBITDA of 14.60, and a Price to Book Value of 1.84. In comparison, Targa Resources Corp. has a P/E of 17.82 and an EV to EBITDA of 11.06, while Cheniere Energy Partners LP boasts a P/E of 15.72 and an EV to EBITDA of 11.33, indicating that Atmos Energy is relatively on par with its peers. In terms of recent performance, Atmos Energy has outperformed the S&P 500 year-to-date with a return of 25.77% compared to the S&P 500's 12.26%. However, over the longer term, its 3-year and 5-year returns of 51.27% and 83.09% respectively lag behind the S&P 500's returns of 67.17% and 85.61%....
Read full news article Announcements

Corporate Actions
Quality key factors
Valuation key factors
Technicals key factors
 Technical Indicator Scale: Bearish, Mildly Bearish, Sideways, Mildly Bullish, Bullish Turned
 Shareholding Snapshot : Sep 2025
Shareholding Compare (%holding)
Domestic Funds
Held in 135 Schemes (40.16%)
Held by 342 Foreign Institutions (17.97%)
Quarterly Results Snapshot (Consolidated) - Sep'25 - YoY

YoY Growth in quarter ended Sep 2025 is 12.10% vs 11.96% in Sep 2024
YoY Growth in quarter ended Sep 2025 is 30.45% vs 13.08% in Sep 2024
Annual Results Snapshot (Consolidated) - Sep'25
YoY Growth in year ended Sep 2025 is 12.91% vs -2.58% in Sep 2024

YoY Growth in year ended Sep 2025 is 14.97% vs 17.73% in Sep 2024
About Atmos Energy Corp.

Company Coordinates


