
Compare Atmus Filtration Technologies, Inc. with Similar Stocks
Dashboard
High Management Efficiency with a high ROCE of 41.98%
Company has a low Debt to Equity ratio (avg) at times
Healthy long term growth as Net Sales has grown by an annual rate of 1.64% and Operating profit at 4.81%
Positive results in Jun 25
With ROCE of 37.84%, it has a attractive valuation with a 5.00 Enterprise value to Capital Employed
Stock DNA
Auto Components & Equipments
USD 4,675 Million (Small Cap)
14.00
NA
0.00%
1.12
64.37%
13.89
Total Returns (Price + Dividend) 
Atmus Filtration Technologies, Inc. for the last several years.
Risk Adjusted Returns v/s
News

Atmus Filtration Technologies Receives Positive Valuation Adjustment Amid Strong Financial Performance
Atmus Filtration Technologies, Inc. has recently experienced a valuation adjustment, highlighting an improved assessment of its financial standing. Key indicators include a competitive P/E ratio, a high return on equity, and a low debt-to-equity ratio, reflecting strong operational efficiency and prudent financial management.
Read full news article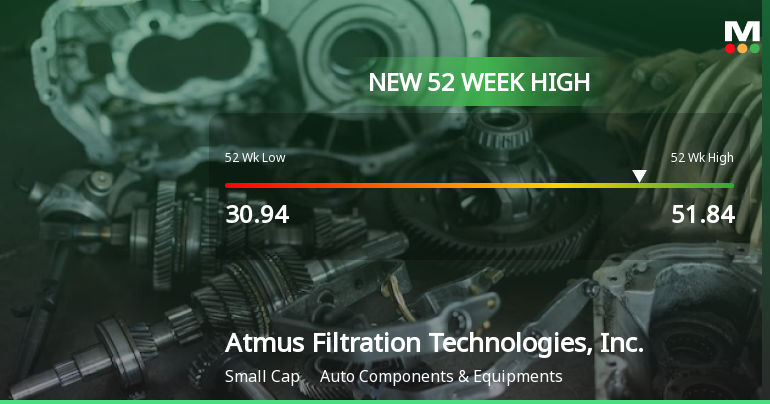
Atmus Filtration Technologies Hits New 52-Week High of $51.84
Atmus Filtration Technologies, Inc. achieved a new 52-week high of USD 51.84, reflecting strong performance in the auto components industry with a one-year growth of 63.43%. The company has a market capitalization of USD 3,795 million and a favorable P/E ratio of 14.00, alongside a high return on equity of 66.44%.
Read full news article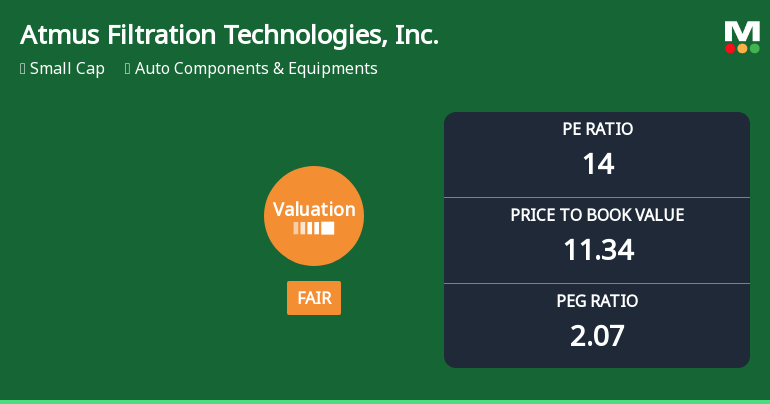
Atmus Filtration Technologies, Inc. Experiences Revision in Stock Evaluation Amid Strong Performance Metrics
Atmus Filtration Technologies, Inc. has recently adjusted its valuation, showcasing a P/E ratio of 14 and strong performance metrics, including a ROCE of 37.84% and ROE of 78.20%. Compared to peers, Atmus maintains a competitive position within the auto components sector, balancing valuation and financial performance.
Read full news article Announcements

Corporate Actions
Quality key factors
Valuation key factors
Technicals key factors
 Technical Indicator Scale: Bearish, Mildly Bearish, Sideways, Mildly Bullish, Bullish Turned
 Shareholding Snapshot : Sep 2025
Shareholding Compare (%holding)
Domestic Funds
Held in 84 Schemes (48.21%)
Held by 119 Foreign Institutions (12.07%)
Quarterly Results Snapshot (Consolidated) - Jun'25 - YoY

YoY Growth in quarter ended Jun 2025 is 4.83% vs 4.59% in Jun 2024

YoY Growth in quarter ended Jun 2025 is 6.58% vs 21.65% in Jun 2024
Annual Results Snapshot (Consolidated) - Dec'24
YoY Growth in year ended Dec 2024 is 2.55% vs 4.23% in Dec 2023
YoY Growth in year ended Dec 2024 is 8.35% vs 0.53% in Dec 2023
About Atmus Filtration Technologies, Inc.

Company Coordinates


