
Compare Atvo Enterprises with Similar Stocks
Dashboard
With a Operating Losses, the company has a Weak Long Term Fundamental Strength
- Company's ability to service its debt is weak with a poor EBIT to Interest (avg) ratio of -0.47
- The company has reported losses. Due to this company has reported negative ROCE
Flat results in Mar 26
Risky - Negative EBITDA
Stock DNA
Garments & Apparels
INR 309 Cr (Micro Cap)
1,403.00
23
0.00%
-0.07
1.79%
25.07
Total Returns (Price + Dividend) 
Atvo Enterprises for the last several years.
Risk Adjusted Returns v/s
Returns Beta

News

Atvo Enterprises Ltd is Rated Sell
Atvo Enterprises Ltd is rated 'Sell' by MarketsMOJO, with this rating last updated on 11 March 2026. However, the analysis and financial metrics discussed here reflect the stock's current position as of 22 June 2026, providing investors with an up-to-date view of the company’s fundamentals, valuation, financial trends, and technical outlook.
Read full news article
Atvo Enterprises Ltd is Rated Sell by MarketsMOJO
Atvo Enterprises Ltd is rated 'Sell' by MarketsMOJO, with this rating last updated on 11 March 2026. However, the analysis and financial metrics discussed here reflect the stock’s current position as of 11 June 2026, providing investors with an up-to-date view of the company’s fundamentals, returns, and market standing.
Read full news article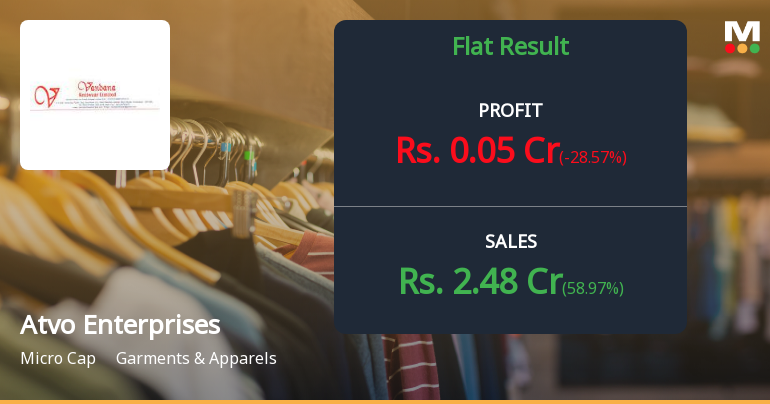
Atvo Enterprises Q4 FY26: Revenue Surge Masks Persistent Operating Losses
Atvo Enterprises Ltd., a micro-cap garments and apparels manufacturer, reported net profit of ₹0.05 crores for Q4 FY26, marking a modest sequential decline of 28.57% from ₹0.07 crores in Q3 FY26, though representing a 150.00% year-on-year improvement from ₹0.02 crores in Q4 FY25. With a market capitalisation of ₹278.00 crores, the stock closed at ₹25.48 on June 5, 2026, down 2.00% on the day, as investors grappled with the company's troubling operational performance despite impressive revenue growth.
Read full news article Announcements
DISCLOSURE OF REASONS FOR DELAY IN SUBMISSION OF AUDITED FINANCIAL RESULTS FOR THE QUARTER AND YEAR ENDED 31ST MARCH 2026
20-Jun-2026 | Source : BSEDelay in submission of Audited Financials Statements for the quarter and year ended 31st march 2026 due to reasons enclosed with this letter
Disclosure Under Regulation 7(2)(B) SEBI (Prohibition Of Insider Trading) Regulations 2015
16-Jun-2026 | Source : BSEPursuant to Regulation 7(2)(b) of the SEBI (PIT) Regulations2015 we are enclosing herewith the disclosure received to the Company under regulation 7 (2) ( a) of PIT Regulations From Promoter Group of the Company.
Disclosures under Reg. 29(2) of SEBI (SAST) Regulations 2011
15-Jun-2026 | Source : BSEThe Exchange has received the disclosure under Regulation 29(2) of SEBI (Substantial Acquisition of Shares & Takeovers) Regulations 2011 for Naresh Gattani HUF & PACs
Corporate Actions

No Upcoming Board Meetings

No Dividend history available

Atvo Enterprises Ltd has announced 1:10 stock split, ex-date: 02 Aug 12

No Bonus history available

No Rights history available
Quality key factors
Valuation key factors
Technicals key factors
 Technical Indicator Scale: Bearish, Mildly Bearish, Sideways, Mildly Bullish, Bullish Turned
 Shareholding Snapshot : Mar 2026
Shareholding Compare (%holding)
Promoters
None
Held by 0 Schemes
Held by 0 FIIs
Siddharth Gattani (27.81%)
Atvo Scriptradex Private Limited (7.73%)
30.73%
Quarterly Results Snapshot (Standalone) - Mar'26 - QoQ

QoQ Growth in quarter ended Mar 2026 is 58.97% vs 18.18% in Dec 2025

QoQ Growth in quarter ended Mar 2026 is -28.57% vs 133.33% in Dec 2025
Half Yearly Results Snapshot (Standalone) - Sep'25
Growth in half year ended Sep 2025 is 12.14% vs 20.98% in Sep 2024
Growth in half year ended Sep 2025 is 28.57% vs 40.00% in Sep 2024
Nine Monthly Results Snapshot (Standalone) - Dec'25
YoY Growth in nine months ended Dec 2025 is 19.86% vs 48.22% in Dec 2024
YoY Growth in nine months ended Dec 2025 is 77.78% vs 28.57% in Dec 2024
Annual Results Snapshot (Standalone) - Mar'26
YoY Growth in year ended Mar 2026 is 34.38% vs 19.95% in Mar 2025
YoY Growth in year ended Mar 2026 is 90.91% vs 10.00% in Mar 2025
About Atvo Enterprises Ltd

Company Coordinates


