
Compare Auri Grow India with Similar Stocks
Dashboard
With a Operating Losses, the company has a Weak Long Term Fundamental Strength
- Company's ability to service its debt is weak with a poor EBIT to Interest (avg) ratio of 1.58
- The company has been able to generate a Return on Equity (avg) of 1.83% signifying low profitability per unit of shareholders funds
The company has declared Negative results for the last 3 consecutive quarters
Risky - Negative EBITDA
Stock DNA
Industrial Manufacturing
INR 49 Cr (Micro Cap)
7.00
37
0.00%
0.08
4.16%
0.31
Total Returns (Price + Dividend) 
Auri Grow India for the last several years.
Risk Adjusted Returns v/s
Returns Beta

News

Auri Grow India Ltd Locks at Upper Circuit With 5% Gain — Buyers Queue, Sellers Absent
At Rs 0.33, the buying was done — not because demand dried up, but because the exchange wouldn't let the stock go any higher. Auri Grow India Ltd locked at its upper circuit of 5% on 25 Jun 2026, with buyers queuing and no sellers willing to part with shares.
Read full news article
Auri Grow India Ltd Locks at Upper Circuit With 3.13% Gain — Buyers Queue, Sellers Absent
At Rs 0.33, the buying was done — not because demand dried up, but because the exchange wouldn't let the stock go any higher. Auri Grow India Ltd locked at its upper circuit of 3.13% on 24 Jun 2026, with buyers queuing and no sellers willing to part with shares.
Read full news article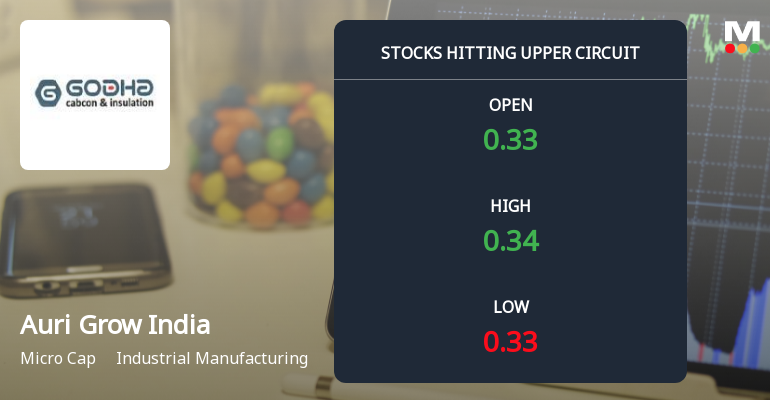
Auri Grow India Ltd Locks at Upper Circuit With 3.03% Gain — Buyers Queue, Sellers Absent
At Rs 0.34, the buying was done — not because demand dried up, but because the exchange wouldn't let the stock go any higher. Auri Grow India Ltd locked at its upper circuit of 3.03% on 23 Jun 2026, with buyers queuing and no sellers willing to part with shares.
Read full news article Announcements
Godha Cabcon & Insulation Limited - Reply to Clarification- Financial results
05-Dec-2019 | Source : NSEGodha Cabcon & Insulation Limitedabcon & Insulation Limited for the quarter ended 30-Sep-2019 with respect to Regulation 33 of the SEBI (Listing Obligations and Disclosure Requirements) Regulations, 2015.
Godha Cabcon & Insulation Limited - Clarification - Financial Results
03-Dec-2019 | Source : NSEGodha Cabcon & Insulation Limited Insulation Limited for the quarter ended 30-Sep-2019 with respect to Regulation 33 of the SEBI (Listing Obligations and Disclosure Requirements) Regulations, 2015.
Godha Cabcon & Insulation Limited - Outcome of Board Meeting
15-Nov-2019 | Source : NSEGodha Cabcon & Insulation Limited has informed the Exchange regarding Board meeting held on November 14, 2019.
Corporate Actions

No Upcoming Board Meetings

No Dividend history available

Auri Grow India Ltd has announced 1:10 stock split, ex-date: 24 Mar 22

Auri Grow India Ltd has announced 1:1 bonus issue, ex-date: 20 Jan 22

Auri Grow India Ltd has announced 2:1 rights issue, ex-date: 12 May 23
Quality key factors
Valuation key factors
Technicals key factors
 Technical Indicator Scale: Bearish, Mildly Bearish, Sideways, Mildly Bullish, Bullish Turned
 Shareholding Snapshot : Mar 2026
Shareholding Compare (%holding)
Non Institution
None
Held by 0 Schemes
Held by 0 FIIs
Dipesh Godha (0.0%)
Abhishek Chowdhury (1.66%)
96.21%
Quarterly Results Snapshot (Standalone) - Mar'26 - YoY

YoY Growth in quarter ended Mar 2026 is -100.00% vs 314.38% in Mar 2025
YoY Growth in quarter ended Mar 2026 is -140.12% vs 165.57% in Mar 2025
Half Yearly Results Snapshot (Standalone) - Sep'25
Growth in half year ended Sep 2025 is -85.11% vs 1,32,285.71% in Sep 2024
Growth in half year ended Sep 2025 is -64.91% vs 365.12% in Sep 2024
Nine Monthly Results Snapshot (Standalone) - Dec'25
YoY Growth in nine months ended Dec 2025 is -87.03% vs 1,51,900.00% in Dec 2024
YoY Growth in nine months ended Dec 2025 is -97.46% vs 661.43% in Dec 2024
Annual Results Snapshot (Standalone) - Mar'26
YoY Growth in year ended Mar 2026 is -92.14% vs 947.43% in Mar 2025
YoY Growth in year ended Mar 2026 is -115.20% vs 1,305.88% in Mar 2025
About Auri Grow India Ltd

Company Coordinates


