
Compare Auro Labs. with Similar Stocks
Dashboard
Weak Long Term Fundamental Strength with a -7.38% CAGR growth in Operating Profits over the last 5 years
- Low ability to service debt as the company has a high Debt to EBITDA ratio of 6.49 times
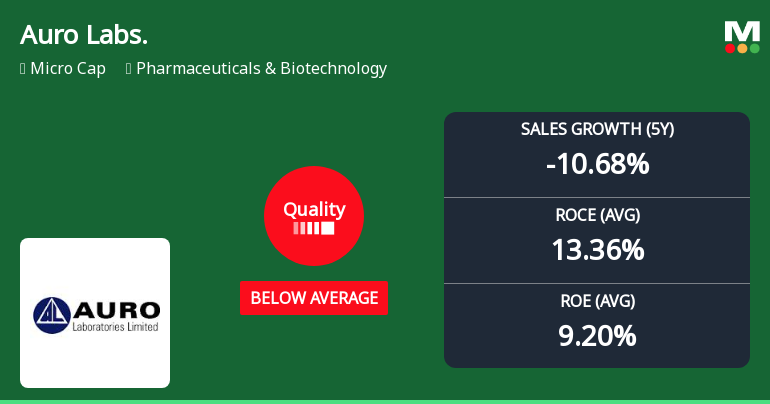
- The company has been able to generate a Return on Equity (avg) of 9.20% signifying low profitability per unit of shareholders funds
With ROCE of 6.4, it has a Very Expensive valuation with a 2 Enterprise value to Capital Employed
Stock DNA
Pharmaceuticals & Biotechnology
INR 165 Cr (Micro Cap)
44.00
33
0.00%
1.33
7.82%
3.43
Total Returns (Price + Dividend) 
Auro Labs. for the last several years.
Risk Adjusted Returns v/s
Returns Beta

News
Auro Laboratories Ltd Downgraded to Below Average Quality Amid Declining Fundamentals
Auro Laboratories Ltd, a micro-cap player in the Pharmaceuticals & Biotechnology sector, has seen its quality grading downgraded from Hold to Sell, reflecting a notable deterioration in its business fundamentals. Key financial parameters such as return on equity (ROE), return on capital employed (ROCE), and growth metrics have weakened, raising concerns about the company’s operational efficiency and financial health amid a challenging industry backdrop.
Read full news article
Auro Laboratories Ltd Reports Positive Quarterly Growth Amid Margin Pressures
Auro Laboratories Ltd, a micro-cap player in the Pharmaceuticals & Biotechnology sector, has reported a positive financial performance for the quarter ended March 2026, with robust revenue growth and improved profitability. However, certain operational metrics indicate emerging challenges, prompting a reassessment of its investment grade from Buy to Hold by MarketsMOJO as of 2 March 2026.
Read full news article
Auro Laboratories Ltd is Rated Hold
Auro Laboratories Ltd is rated 'Hold' by MarketsMOJO, with this rating last updated on 02 Mar 2026. However, the analysis and financial metrics discussed here reflect the company’s current position as of 31 May 2026, providing investors with an up-to-date view of its fundamentals, returns, and overall market stance.
Read full news article Announcements
Announcement under Regulation 30 (LODR)-Newspaper Publication
01-Jun-2026 | Source : BSEEnclosed herewith Newspaper Advertisement
Board Meeting Outcome for Held On May 29 2026
29-May-2026 | Source : BSEPursuant to the provisions of Regulation 30 of the SEBI (Listing Obligations and Disclosure Requirements) Regulations 2015 we wish to inform you that the Board of Directors of the Company at their meeting held today i.e. May 29 2026 inter-alia considered the matters as enclosed herewith.
Compliances-Reg.24(A)-Annual Secretarial Compliance
29-May-2026 | Source : BSEEnclosed herewith Annual Secretarial Compliance Report for the Year Ended March 31 2026.
Corporate Actions

No Upcoming Board Meetings

No Dividend history available

No Splits history available

No Bonus history available

No Rights history available
Quality key factors
Valuation key factors
Technicals key factors
 Technical Indicator Scale: Bearish, Mildly Bearish, Sideways, Mildly Bullish, Bullish Turned
 Shareholding Snapshot : Mar 2026
Shareholding Compare (%holding)
Promoters
None
Held by 1 Schemes (0.01%)
Held by 0 FIIs
Auro Impex Private Ltd (18.75%)
Kirtilaben Jayantilal Mehta (3.13%)
36.28%
Quarterly Results Snapshot (Standalone) - Mar'26 - QoQ

QoQ Growth in quarter ended Mar 2026 is 4.69% vs 6.22% in Dec 2025
QoQ Growth in quarter ended Mar 2026 is -50.26% vs 170.83% in Dec 2025
Half Yearly Results Snapshot (Standalone) - Sep'25

Growth in half year ended Sep 2025 is 31.63% vs -62.61% in Sep 2024
Growth in half year ended Sep 2025 is -45.05% vs -58.58% in Sep 2024
Nine Monthly Results Snapshot (Standalone) - Dec'25
YoY Growth in nine months ended Dec 2025 is 76.92% vs -71.45% in Dec 2024
YoY Growth in nine months ended Dec 2025 is 120.69% vs -78.56% in Dec 2024
Annual Results Snapshot (Standalone) - Mar'26
YoY Growth in year ended Mar 2026 is 58.45% vs -63.83% in Mar 2025
YoY Growth in year ended Mar 2026 is 91.85% vs -76.38% in Mar 2025
About Auro Laboratories Ltd

Company Coordinates


