
Compare Ausom Enter. with Similar Stocks
Dashboard
Poor long term growth as Operating profit has grown by an annual rate -10.25% of over the last 5 years
- PAT(Q) At Rs 0.83 cr has Fallen at -92.5%
- INVENTORY TURNOVER RATIO(HY) Lowest at 115.57 times
- NET SALES(Q) At Rs 1,440.43 cr has Grown at -5.65%
With ROE of 12.1, it has a Attractive valuation with a 1 Price to Book Value
Majority shareholders : Promoters
Consistent Returns over the last 3 years
Stock DNA
Gems, Jewellery And Watches
INR Cr (Micro Cap)
8.00
15
0.00%
0.00
0.00%
0.00
Total Returns (Price + Dividend) 
Latest dividend: 1 per share ex-dividend date: Sep-19-2025
Risk Adjusted Returns v/s
Returns Beta

News
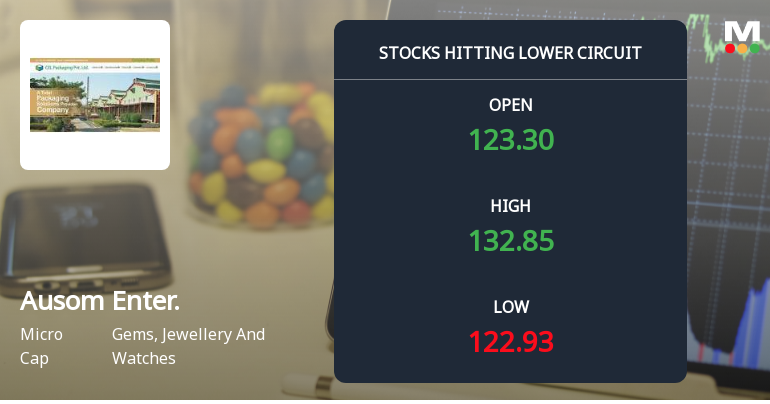
Below All Moving Averages and Now at Lower Circuit: Ausom Enterprise Ltd Loses 4.99% in a Single Session
At Rs 122.93, sellers were still queuing — but there were no buyers willing to take the other side. Ausom Enterprise Ltd locked at its lower circuit of 5% on 2 Jun 2026, with unfilled sell orders and a frozen price, signalling persistent selling pressure in a micro-cap stock with limited liquidity.
Read full news article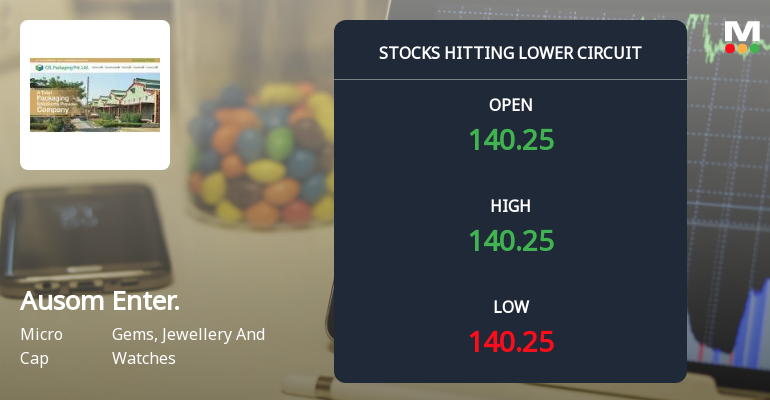
Ausom Enterprise Ltd Locks at Lower Circuit With 4.99% Loss — Sellers Queue, No Buyers in Sight
At Rs 129.36, sellers were still queuing — but there were no buyers willing to take the other side. Ausom Enterprise Ltd locked at its lower circuit of 4.99% on 1 Jun 2026, with unfilled sell orders and a frozen price, reflecting persistent selling pressure in a micro-cap stock with limited liquidity.
Read full news article
Ausom Enterprise Ltd is Rated Hold by MarketsMOJO
Ausom Enterprise Ltd is rated 'Hold' by MarketsMOJO, with this rating last updated on 29 May 2026. However, the analysis and financial metrics discussed here reflect the stock's current position as of 31 May 2026, providing investors with the most up-to-date insight into the company’s performance and outlook.
Read full news article Announcements
Announcement under Regulation 30 (LODR)-Newspaper Publication
30-May-2026 | Source : BSENewspaper Publication - Submission of the copy of the newspaper cutting of the extract of Audited Standalone and Consolidated Financial Results for the quarter and financial year ended 31st March 2026
Announcement under Regulation 30 (LODR)-Change in Management
29-May-2026 | Source : BSERe-appointment of Internal Auditor of the Company for FY 2026-27
Results - Financial Results For March 31 2026
29-May-2026 | Source : BSEResults - Financial Results for March 31 2026
Corporate Actions

No Upcoming Board Meetings

Ausom Enterprise Ltd has declared 10% dividend, ex-date: 19 Sep 25

No Splits history available

No Bonus history available

No Rights history available
Quality key factors
Valuation key factors
Technicals key factors
 Technical Indicator Scale: Bearish, Mildly Bearish, Sideways, Mildly Bullish, Bullish Turned
 Shareholding Snapshot : Mar 2026
Shareholding Compare (%holding)
Promoters
None
Held by 0 Schemes
Held by 1 FIIs (0.11%)
Harish Purshottam Pawani (36.85%)
Minesh Madhusudan Soni (3.82%)
23.16%
Quarterly Results Snapshot (Consolidated) - Mar'26 - YoY

YoY Growth in quarter ended Mar 2026 is -5.65% vs 115.72% in Mar 2025
YoY Growth in quarter ended Mar 2026 is -92.48% vs 291.49% in Mar 2025
Half Yearly Results Snapshot (Consolidated) - Sep'25
Growth in half year ended Sep 2025 is -31.83% vs 1,226.93% in Sep 2024

Growth in half year ended Sep 2025 is 98.68% vs 53.21% in Sep 2024
Nine Monthly Results Snapshot (Consolidated) - Dec'25
YoY Growth in nine months ended Dec 2025 is -25.57% vs 232.18% in Dec 2024
YoY Growth in nine months ended Dec 2025 is 119.15% vs 34.44% in Dec 2024
Annual Results Snapshot (Consolidated) - Mar'26
YoY Growth in year ended Mar 2026 is -12.86% vs 147.07% in Mar 2025
YoY Growth in year ended Mar 2026 is -0.36% vs 113.43% in Mar 2025
About Ausom Enterprise Ltd

Company Coordinates


