
Compare Australian Prem with Similar Stocks
Stock DNA
Other Electrical Equipment
INR 608 Cr (Micro Cap)
13.00
56
0.03%
0.06
34.90%
3.76
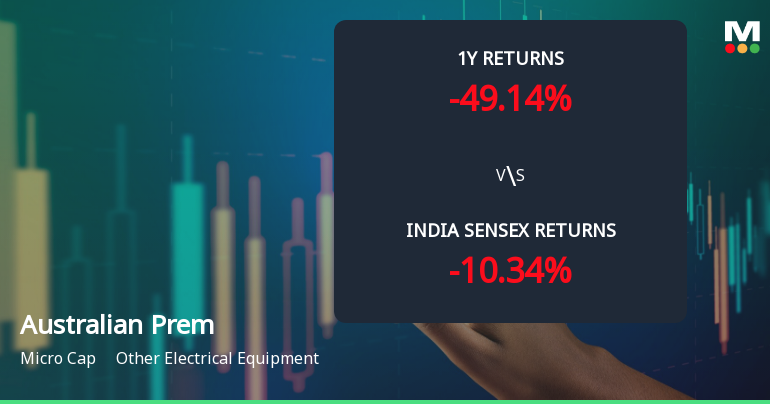
Total Returns (Price + Dividend) 
Latest dividend: 0.1 per share ex-dividend date: Nov-07-2025
Risk Adjusted Returns v/s
Returns Beta

News
Australian Premium Solar (India) Ltd Faces Bearish Technical Shift Amid Weak Price Momentum
Australian Premium Solar (India) Ltd has seen a notable shift in its technical momentum, with key indicators signalling a transition from mildly bearish to a more pronounced bearish trend. The company’s micro-cap status, combined with a recent downgrade in its Mojo Grade from Hold to Sell, reflects growing caution among investors amid weakening price momentum and mixed technical signals.
Read full news article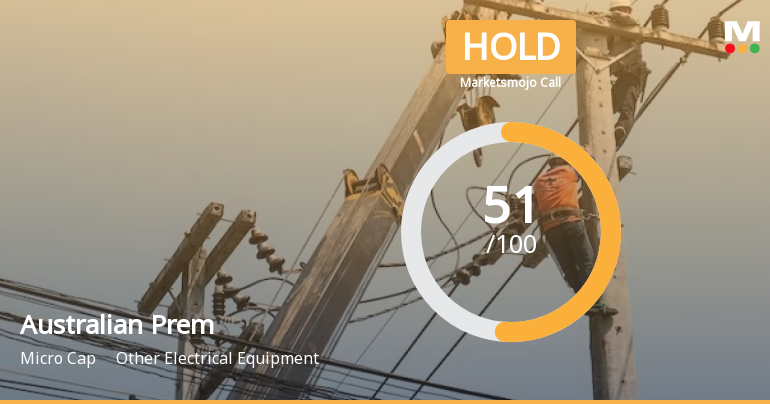
Australian Premium Solar (India) Ltd is Rated Hold
Australian Premium Solar (India) Ltd is rated 'Hold' by MarketsMOJO, with this rating last updated on 22 May 2026. While the rating change occurred on that date, the analysis and financial metrics discussed here reflect the stock’s current position as of 04 June 2026, providing investors with the latest insights into the company’s performance and outlook.
Read full news article
Australian Premium Solar (India) Ltd Valuation Shifts Signal Renewed Price Attractiveness
Australian Premium Solar (India) Ltd has witnessed a significant transformation in its valuation metrics, moving from a risky to a very attractive investment proposition. This shift, underscored by improved price-to-earnings and price-to-book ratios, alongside robust return metrics, has prompted a reassessment of the stock’s appeal within the Other Electrical Equipment sector.
Read full news article Announcements
Corporate Actions

No Upcoming Board Meetings

Australian Premium Solar (India) Ltd has declared 1% dividend, ex-date: 07 Nov 25

No Splits history available

No Bonus history available

No Rights history available
Quality key factors
Valuation key factors
Technicals key factors
 Technical Indicator Scale: Bearish, Mildly Bearish, Sideways, Mildly Bullish, Bullish Turned
 Shareholding Snapshot : Mar 2026
Shareholding Compare (%holding)
Promoters
None
Held by 0 Schemes
Held by 0 FIIs
Nikunjkumar Chimanlal Patel (37.13%)
Nitaben Alpeshbhai Patel (1.54%)
24.26%
Quarterly Results Snapshot (Standalone) - Jun'25 - QoQ

QoQ Growth in quarter ended Jun 2025 is 2.64% vs 22.50% in Mar 2025
QoQ Growth in quarter ended Jun 2025 is -1.37% vs 28.96% in Mar 2025
Half Yearly Results Snapshot (Consolidated) - Mar'26

Growth in half year ended Mar 2026 is 34.06% vs 9.94% in Sep 2025
Growth in half year ended Mar 2026 is 2.31% vs 5.89% in Sep 2025
Nine Monthly Results Snapshot (Consolidated) - Jun'25
YoY Growth in nine months ended Jun 2025 is 59.76% vs 21.73% in Dec 2024
YoY Growth in nine months ended Jun 2025 is 76.73% vs 41.54% in Dec 2024
Annual Results Snapshot (Consolidated) - Mar'26
YoY Growth in year ended Mar 2026 is 61.31% vs 193.23% in Mar 2025
YoY Growth in year ended Mar 2026 is 44.31% vs 552.03% in Mar 2025
About Australian Premium Solar (India) Ltd

Company Coordinates


