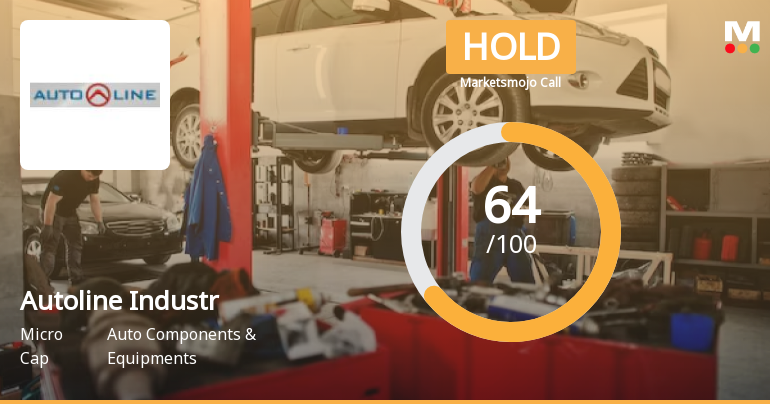
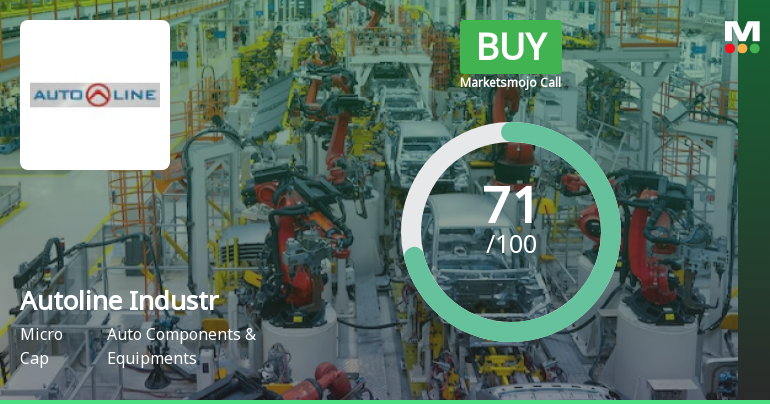
Autoline Industr

  • Market Cap: Micro Cap
  • Industry: Auto Components & Equipments
  • ISIN: INE718H01014
  • NSEID: AUTOIND
  • BSEID: 532797
INR
86.11
-0.92 (-1.06%)
BSENSE

Sep 09, 03:30 PM

BSE+NSE Vol: 1.26 lacs

  • Price Points
  • Score
  • Mojo Parameters
  • Total Return
  • News and Corporate Actions
  • Key factors
  • Shareholding
  • Financials
  • CompanyCV
stock-summaryPrice Point
High/Low

1Day

52 Week

Valuation
Technical
Day's Volume

CASH

1.26 lacs (-80.99%) Volume

Shareholding (Jun 2026)

FII

0.60%

Held by 3 FIIs

DII

5.63%

Held by 0 DIIs

Promoter

32.60%

Why is Autoline Industries Ltd falling/rising?

06-Sep-2026

As of 05-Sep, Autoline Industries Ltd's stock price is Rs 86.66, down 6.77% today and showing a decline of 2.20% over the past week. Despite a year-to-date increase of 8.79%, its three-year performance is negative at -3.31%, contrasting with the Sensex's positive return.

As of 05-Sep, Autoline Industries Ltd's stock price is falling, currently at Rs 86.66, which reflects a decrease of Rs 6.29 or 6.77%. The stock has underperformed compared to the sector by 6.94% today. Throughout the trading day, the stock reached a high of Rs 95 but also dipped to a low of Rs 86, indicating significant volatility with an intraday volatility of 6.35%. <BR><BR>In terms of performance over different periods, the stock has shown a decline of 2.20% over the past week and 4.04% over the past month, while it has performed positively year-to-date with an increase of 8.79%. However, its performance over the last three years has been negative at -3.31%, contrasting with the Sensex's positive return of 16.59% during the same period. <BR><BR>Despite a notable rise in investor participation, with delivery volume increasing by 433.23% against the 5-day average, the stock's current price movement indicates a downward trend, influenced by its recent performance metrics and market conditions.

View full answer

Who are in the management team of Autoline Industr?

01-Sep-2026

The management team of Autoline Industr includes Shivaji T Akhade (Managing Director), Sudhir V Mungase (Whole-time Director), C A Vijay K Thanawala, Prakash B Nimbalkar, and Rajashri Sai (Independent Directors), Shilpa Walunj (Company Secretary), and Sridhar Ramachandran (Nominee). They are responsible for the company's strategic direction and operations.

The management team of Autoline Industr includes the following individuals:<BR><BR>1. **Shivaji T Akhade** - Managing Director<BR>2. **Sudhir V Mungase** - Whole-time Director<BR>3. **C A Vijay K Thanawala** - Independent Director<BR>4. **Prakash B Nimbalkar** - Chairman & Independent Director<BR>5. **Rajashri Sai** - Independent Director<BR>6. **Shilpa Walunj** - Company Secretary<BR>7. **Sridhar Ramachandran** - Nominee<BR><BR>This team plays a crucial role in guiding the company’s strategic direction and operations.

View full answer

What does Autoline Industr do?

01-Sep-2026

Autoline Industries Ltd is a micro-cap company in the auto components industry, with recent net sales of ₹265 Cr and a net profit of ₹2 Cr as of June 2026. The company, established in 1995, has a market cap of ₹402 Cr and key financial metrics include a P/E ratio of 16.00 and a debt-equity ratio of 1.60.

Overview: <BR>Autoline Industries Ltd operates in the auto components and equipment industry and is categorized as a micro-cap company.<BR><BR>History: <BR>The company was initially established as a partnership firm named 'Autoline Pressings' in January 1995 and was incorporated as 'Autoline Stampings Private Limited' on December 16, 1996. It was later renamed 'Autoline Industries Private Limited' and subsequently changed to 'Autoline Industries Limited' in 2006. The latest quarterly results reported net sales and profit for June 2026.<BR><BR>Financial Snapshot: <BR>Most recent Net Sales: 265 Cr (Quarterly Results - Jun 2026) <BR>Most recent Net Profit: 2 Cr (Quarterly Results - Jun 2026) <BR>Market-cap value: INR 402 Cr (Micro Cap)<BR><BR>Key Metrics: <BR>P/E: 16.00 <BR>Industry P/E: 41 <BR>Dividend Yield: 0.00% <BR>Debt-Equity: 1.60 <BR>Return on Equity: 11.41% <BR>Price to Book: 2.05 <BR><BR>Contact Details: <BR>Address: Survey Nos 313 314 320 - 323, Nanewarkadi Chakan Taluka Khed Pune Maharashtra : 410501 <BR>Tel: 91-2135-664865/6 <BR>Email: investorservices@autolineind.com <BR>Website: http://www.autolineind.com

View full answer

Who are the peers of the Autoline Industr?

01-Sep-2026

Autoline Industr's peers include Hind.Composites, Triton Valves, CLN Energy, Munjal Showa, Omax Autos, Emmforce Auto., PPAP Automotive, Menon Pistons, and Ucal. In terms of management risk, growth, and capital structure, CLN Energy and Emmforce Auto. stand out positively, while Hind.Composites and Ucal show weaker performance.

Peers: The peers of Autoline Industr are Hind.Composites, Triton Valves, CLN Energy, Munjal Showa, Omax Autos, Emmforce Auto., PPAP Automotive, Menon Pistons, and Ucal.<BR><BR>Quality Snapshot: Excellent management risk is observed at CLN Energy and Emmforce Auto., while Good management risk is found at Menon Pistons. Average management risk is present at Hind.Composites, Munjal Showa, Omax Autos, Autoline Industr, and PPAP Automotive, and the rest. Below Average management risk is noted at Triton Valves and Ucal. Growth is Excellent at CLN Energy, Good at Autoline Industr and Emmforce Auto., and Below Average at Hind.Composites, Munjal Showa, Triton Valves, PPAP Automotive, and the rest. Average growth is seen at Omax Autos, while Ucal has Below Average growth. Capital Structure is Excellent at CLN Energy and Menon Pistons, Good at Emmforce Auto., Average at Hind.Composites, Munjal Showa, Autoline Industr, Omax Autos, PPAP Automotive, and the rest, and Below Average at Triton Valves and Ucal.<BR><BR>Return Snapshot: Emmforce Auto. has the highest 1-year return at 85.28%, while Hind.Composites has the lowest at -10.69%. Autoline Industr's 1-year return of 23.40% is higher than Hind.Composites but lower than Emmforce Auto. Additionally, the six-month return is negative for Hind.Composites, Munjal Showa, and Omax Autos.

View full answer

How big is Autoline Industr?

01-Sep-2026

As of 31st August, Autoline Industries Ltd has a market capitalization of 402.00 Cr, with recent net sales of 937.55 Cr and a net profit of 39.90 Cr. Shareholder's funds are 153.09 Cr, and total assets amount to 745.44 Cr as of March 2025.

As of 31st August, Autoline Industries Ltd has a market capitalization of 402.00 Cr, classified as a Micro Cap.<BR><BR>In the latest four quarters, the company reported Net Sales of 937.55 Cr and a Net Profit of 39.90 Cr.<BR><BR>The latest annual period for the balance sheet is March 2025, with Shareholder's Funds amounting to 153.09 Cr and Total Assets of 745.44 Cr.

View full answer

Should I buy, sell or hold Autoline Industries Ltd?

01-Sep-2026

Are Autoline Industries Ltd latest results good or bad?

16-May-2026

Autoline Industries Ltd's latest results show strong profit and revenue growth, with a net profit of ₹30.41 crore and a 48.37% revenue increase. However, declining operating margins and a low tax rate raise concerns about the sustainability of this performance, leading to cautious investor sentiment reflected in a stock price decline.

Autoline Industries Ltd's latest results present a mixed picture. On one hand, the company reported a significant net profit of ₹30.41 crore for Q4 FY26, reflecting a remarkable 529.61% increase quarter-on-quarter and a 366.41% increase year-on-year. Additionally, revenue grew by 48.37% year-on-year to ₹289.31 crore, marking the highest quarterly sales in the company's history.<BR><BR>However, there are concerns regarding the sustainability of this performance. The operating margin has declined slightly to 9.84%, down from 10.36% a year earlier, indicating potential challenges with rising input costs or pricing pressures. Moreover, the exceptionally low tax rate of 0.13% in this quarter has artificially inflated profits, suggesting that future earnings may not be as robust once normalized tax rates are applied.<BR><BR>Investor sentiment appears cautious, as evidenced by a 2.46% decline in the stock price following the results announcement. This reaction reflects concerns about the company's ability to maintain its profit growth amidst operational challenges and high leverage, which could impact future profitability.<BR><BR>In summary, while the revenue and profit growth figures are impressive, the underlying issues related to margins and the sustainability of earnings raise red flags for investors.

View full answer

How has been the historical performance of Autoline Industr?

09-Nov-2025

Autoline Industr has demonstrated strong financial growth from March 2021 to March 2025, with net sales increasing from 284.69 Cr to 658.55 Cr, operating profit rising from 8.54 Cr to 68.28 Cr, and profit after tax improving from a loss of 41.87 Cr to a profit of 17.94 Cr. The company also enhanced its cash flow from operating activities, reaching 66 Cr in March 2025.

Answer:<BR>The historical performance of Autoline Industr shows a gradual improvement in key financial metrics over the years, particularly from March 2021 to March 2025.<BR><BR>Breakdown:<BR>Autoline Industr's net sales have steadily increased from 284.69 Cr in March 2021 to 658.55 Cr in March 2025, reflecting a strong growth trajectory. Total operating income followed a similar trend, rising from 284.69 Cr in March 2021 to 658.55 Cr in March 2025. The company has managed to reduce its total expenditure from 611.19 Cr in March 2023 to 590.27 Cr in March 2025, contributing to an increase in operating profit, which rose from 8.54 Cr in March 2021 to 68.28 Cr in March 2025. Profit before tax also improved significantly, reaching 18.96 Cr in March 2025, compared to a loss of 41.87 Cr in March 2021. Consequently, profit after tax increased from a loss of 41.87 Cr in March 2021 to 17.94 Cr in March 2025. The total liabilities of the company rose from 418.21 Cr in March 2020 to 745.44 Cr in March 2025, while total assets increased from 418.21 Cr to 745.44 Cr in the same period. Cash flow from operating activities improved significantly, reaching 66 Cr in March 2025, up from a negative cash flow in previous years. Overall, Autoline Industr has shown a positive trend in financial performance, with increasing revenues and profits alongside a growing asset base.

View full answer

When is the next results date for Autoline Industr?

31-Oct-2025

The next results date for Autoline Industr is 08 November 2025.

The next results date for Autoline Industr is scheduled for 08 November 2025.

View full answer

Who are the top shareholders of the Autoline Industr?

17-Jul-2025

As of June 2025, the top shareholders of Autoline Industr include Shivaji Tukaram Akhade with 15.32%, the Indianivesh Renaissance Fund at 10.57%, and individual investors holding a total of 31.15%. There are no pledged promoter holdings or mutual funds involved.

The top shareholders of Autoline Industr as of June 2025 include Shivaji Tukaram Akhade, who is the promoter with the highest holding at 15.32%. The highest public shareholder is the Indianivesh Renaissance Fund, holding 10.57%. Additionally, individual investors collectively hold 31.15% of the shares. There is also one foreign institutional investor (FII) that holds 0.03% of the company. Notably, there are no pledged promoter holdings and no mutual funds involved.

View full answer

Is Autoline Industr overvalued or undervalued?

09-Jun-2025

As of May 26, 2025, Autoline Industr is considered fairly valued with a PE ratio of 15.89, an EV to EBITDA of 8.78, and a ROE of 14.09%, showing strong long-term performance but underperforming in the past year compared to the Sensex.

As of 26 May 2025, the valuation grade for Autoline Industr has moved from very attractive to attractive, indicating a shift in perception regarding its investment potential. The company is currently considered fairly valued. Key ratios include a PE ratio of 15.89, an EV to EBITDA of 8.78, and a ROE of 14.09%. <BR><BR>In comparison to its peers, Autoline Industr's PE ratio is significantly lower than that of Samvardhana Motherson, which stands at 29.14, and much lower than the expensive valuations of Bosch and Uno Minda, which are at 46.21 and 66.72, respectively. While Autoline Industr has shown a strong performance over the long term with a 5-year return of 383.55%, it has underperformed relative to the Sensex in the past year with a decline of 25.23% compared to the Sensex's 7.60% gain.

View full answer

What is the technical trend for Autoline Industr?

09-Jun-2025

As of May 12, 2025, Autoline Industr's technical trend is mildly bearish, with mixed signals across timeframes, including mildly bullish weekly indicators but bearish monthly trends.

As of 12 May 2025, the technical trend for Autoline Industr has changed from bearish to mildly bearish. The weekly MACD and Bollinger Bands indicate a mildly bullish stance, while the monthly indicators remain bearish. The daily moving averages are mildly bearish, suggesting short-term weakness. The KST shows a mildly bullish trend on the weekly timeframe, but the monthly remains bearish. The Dow Theory indicates no trend in both weekly and monthly perspectives. Overall, the current technical stance is mildly bearish, driven by mixed signals across different timeframes.

View full answer

Has Autoline Industr declared dividend?

06-Jun-2025

Autoline Industries Ltd has declared a 10% dividend, amounting to 1 per share, but the dividend yield is 0%. While the company has shown significant price returns over longer periods, dividends have not contributed to returns recently.

Autoline Industries Ltd has declared a 10% dividend.<BR><BR>Dividend Details:<BR>- Percentage announced: 10%<BR>- Amount per share: 1 per share<BR>- Ex-date: Sep-19-2013<BR><BR>Dividend Yield: 0%<BR><BR>Total Returns by Period:<BR>Over the 6-month period, the price return was -25.13%, the dividend return was 0%, resulting in a total return of -25.13%.<BR><BR>In the 1-year period, the price return was -26.06%, the dividend return was 0%, leading to a total return of -26.06%.<BR><BR>For the 2-year period, the price return was 25.22%, the dividend return was 0%, which resulted in a total return of 25.22%.<BR><BR>During the 3-year period, the price return was 38.26%, the dividend return was 0%, culminating in a total return of 38.26%.<BR><BR>In the 4-year period, the price return was 124.51%, the dividend return was 0%, giving a total return of 124.51%.<BR><BR>Over the 5-year period, the price return was 414.57%, the dividend return was 0%, resulting in a total return of 414.57%.<BR><BR>Overall, while Autoline Industries Ltd has declared a dividend, the dividend yield remains at 0%, indicating that dividends have not contributed to returns in recent periods. The total returns show significant variability, with positive returns over longer periods, particularly in the 4 and 5-year spans.

View full answer
iScoreScore
Click here to find our call on this stock
Strong Sell
Sell
Hold
Buy
Strong Buy

Dashboard

1

Low ability to service debt as the company has a high Debt to EBITDA ratio of 4.12 times

  • Low ability to service debt as the company has a high Debt to EBITDA ratio of 4.12 times
  • The company has been able to generate a Return on Equity (avg) of 9.18% signifying low profitability per unit of shareholders funds
2

Healthy long term growth as Operating profit has grown by an annual rate 63.37%

 
3

Positive results in Jun 26

4

With ROCE of 11.1, it has a Attractive valuation with a 1.4 Enterprise value to Capital Employed

5

Majority shareholders : Non Institution

 
6

Market Beating Performance

stock-summaryMojo Parameters

Mojo Parameters

Loading Valuation Snapshot...

Stock DNA

stock-summary
Industry

Auto Components & Equipments

stock-summary
Market cap

INR 391 Cr (Micro Cap)

stock-summary
P/E

16.00

stock-summary
Industry P/E

40

stock-summary
Dividend Yield

0.00%

stock-summary
Debt Equity

1.60

stock-summary
Return on Equity

11.41%

stock-summary
Price to Book

1.99

Revenue and Profits:
Net Sales:
265 Cr
(Quarterly Results - Jun 2026)
Net Profit:
2 Cr
stock-summaryTotal Returns
Total Returns (Price + Dividend) stock-summary
Dividend Yield (0%)
TimePeriod
Price Return
Dividend Return
Total Return
3 Months
12.68%
0%
12.68%
6 Months
30.17%
0%
30.17%
1 Year
14.55%
0%
14.55%
2 Years
-37.21%
0%
-37.21%
3 Years
-5.48%
0%
-5.48%
4 Years
-1.36%
0%
-1.36%
5 Years
62.01%
0%
62.01%

Latest dividend: 1 per share ex-dividend date: Sep-19-2013

Risk Adjusted Returns v/s stock-summary
Returns Beta
Icon
Beta has not been calculated since enough price history is not available
stock-summaryNews & Corporate Actions

News

Autoline Industries Ltd Falls 4.16%: 5 Key Factors Behind the Volatile Week

Announcements stock-summary

Autoline Industries Limited - Press Release

28-Nov-2019 | Source : NSE

Autoline Industries Limited has informed the Exchange regarding a press release dated November 27, 2019, titled "Press Release- Autoline Industries Limited enters into an Agreement with Kinetic Green Energy and Power Solutions Limited for E-cycles. ".

Autoline Industries Limited - Updates

15-Nov-2019 | Source : NSE

Autoline Industries Limited has informed the Exchange regarding ''. Newspaper advertisements published in Financial Express (English) and Loksatta (Marathi) with regards to the Extract of Unaudited Financial Results for Quarter and Half year ended on September 30, 2019.

Autoline Industries Limited - Outcome of Board Meeting

14-Nov-2019 | Source : NSE

Autoline Industries Limited has informed the Exchange regarding Board meeting held on November 13, 2019. Pursuant to Regulations 30 and 33 of the Securities and Exchange Board of India (Listing Obligation and Disclosure Requirements) Regulations, 2015 we would like to inform that the Board of Directors of the Company at its meeting held on Wednesday, November 13, 2019 inter-alia, considered and approved Unaudited Financial Results (Standalone and Consolidated) of the Company prepared in accordance with the IND-AS for the quarter & half year ended September 30, 2019 along with Limited review report issued by the Auditors of the Company, in respect of the aforesaid Unaudited Financial Results.

Corporate Actions stock-summary

stock-summary
BOARD MEETING

No Upcoming Board Meetings

stock-summary
DIVIDEND

Autoline Industries Ltd has declared 10% dividend, ex-date: 19 Sep 13

stock-summary
SPLITS

No Splits history available

stock-summary
BONUS

No Bonus history available

stock-summary
RIGHTS

No Rights history available

stock-summaryKey Factors

Quality key factors stock-summary

Factor
Value
Sales Growth (5y)
21.63%
EBIT Growth (5y)
63.37%
EBIT to Interest (avg)
1.40
Debt to EBITDA (avg)
4.21
Net Debt to Equity (avg)
1.60
Sales to Capital Employed (avg)
2.02
Tax Ratio
0.42%
Dividend Payout Ratio
0
Pledged Shares
0
Institutional Holding
6.23%
ROCE (avg)
10.46%
ROE (avg)
9.18%

Valuation key factors

Factor
Value
P/E Ratio
16
Industry P/E
40
Price to Book Value
1.99
EV to EBIT
11.61
EV to EBITDA
8.40
EV to Capital Employed
1.38
EV to Sales
0.76
PEG Ratio
0.38
Dividend Yield
NA
ROCE (Latest)
11.09%
ROE (Latest)
11.41%

Technicals key factors

Indicator
Weekly
Monthly
MACD
Mildly Bearish
Mildly Bullish
RSI
Bearish
No Signal
Bollinger Bands
Mildly Bullish
Sideways
Moving Averages
Mildly Bullish (Daily)
KST
Mildly Bearish
Mildly Bullish
Dow Theory
Mildly Bearish
Mildly Bullish
OBV
No Trend
Bullish
stock-summary Technical Indicator Scale: Bearish, Mildly Bearish, Sideways, Mildly Bullish, Bullish  Turned 
stock-summaryShareholding
Shareholding Snapshot : Jun 2026stock-summary
Shareholding Compare (%holding) stock-summary
Majority shareholders

Non Institution

Pledged Promoter Holdings

None

Mutual Funds

Held by 0 Schemes

FIIs

Held by 3 FIIs (0.6%)

Promoter with highest holding

Shivaji Tukaram Akhade (15.32%)

Highest Public shareholder

Sharjah Cement & Industrial Development Co (7.19%)

Individual Investors Holdings

38.9%

stock-summaryFinancial
[
  {
    "link": "quarterly",
    "btn_text": "All Quarterly Results",
    "header": "Quarterly Results Snapshot (Consolidated) - Jun'26 - QoQ",
    "rhs": [
      {
        "prefix": "Net Sales ",
        "suffix": "QoQ Growth in quarter ended Jun 2026 is -8.24% vs 38.12% in Mar 2026",
        "dir": -1
      },
      {
        "prefix": "Consolidated Net Profit ",
        "suffix": "QoQ Growth in quarter ended Jun 2026 is -93.82% vs 529.61% in Mar 2026",
        "dir": -1
      }
    ],
    "table": {
      "header": [
        "Jun'26",
        "Mar'26",
        "Change(%)"
      ],
      "body": [
        {
          "field": "Net Sales",
          "val1": "265.47",
          "val2": "289.31",
          "chgp": "-8.24%",
          "chgp_class": "negative"
        },
        {
          "field": "Operating Profit (PBDIT) excl Other Income",
          "val1": "19.17",
          "val2": "28.46",
          "chgp": "-32.64%",
          "chgp_class": "negative"
        },
        {
          "field": "Interest",
          "val1": "11.65",
          "val2": "10.37",
          "chgp": "12.34%",
          "chgp_class": "negative"
        },
        {
          "field": "Exceptional Items",
          "val1": "0.00",
          "val2": "15.56",
          "chgp": "-100.00%",
          "chgp_class": "negative"
        },
        {
          "field": "Consolidate Net Profit",
          "val1": "1.88",
          "val2": "30.41",
          "chgp": "-93.82%",
          "chgp_class": "negative"
        },
        {
          "field": "Operating Profit Margin (Excl OI)",
          "val1": "7.22%",
          "val2": "9.84%",
          "chgp": "-2.62%",
          "chgp_class": "negative"
        }
      ]
    }
  },
  {
    "link": "half-yearly",
    "btn_text": "All Half Yearly Results",
    "header": "Half Yearly Results Snapshot (Consolidated) - Sep'25",
    "rhs": [
      {
        "prefix": "Net Sales ",
        "suffix": " Growth in half year ended Sep 2025 is 5.79% vs -1.12% in Sep 2024",
        "dir": 1
      },
      {
        "prefix": "Consolidated Net Profit ",
        "suffix": " Growth in half year ended Sep 2025 is -68.00% vs 108.94% in Sep 2024",
        "dir": -1
      }
    ],
    "table": {
      "header": [
        "Sep'25",
        "Sep'24",
        "Change(%)"
      ],
      "body": [
        {
          "field": "Net Sales",
          "val1": "325.29",
          "val2": "307.49",
          "chgp": "5.79%",
          "chgp_class": "positive"
        },
        {
          "field": "Operating Profit (PBDIT) excl Other Income",
          "val1": "30.57",
          "val2": "31.20",
          "chgp": "-2.02%",
          "chgp_class": "negative"
        },
        {
          "field": "Interest",
          "val1": "19.24",
          "val2": "14.51",
          "chgp": "32.60%",
          "chgp_class": "negative"
        },
        {
          "field": "Exceptional Items",
          "val1": "6.28",
          "val2": "0.00",
          "chgp": "",
          "chgp_class": "neutral"
        },
        {
          "field": "Consolidate Net Profit",
          "val1": "3.29",
          "val2": "10.28",
          "chgp": "-68.00%",
          "chgp_class": "negative"
        },
        {
          "field": "Operating Profit Margin (Excl OI)",
          "val1": "9.40%",
          "val2": "10.15%",
          "chgp": "-0.75%",
          "chgp_class": "negative"
        }
      ]
    }
  },
  {
    "link": "nine-monthly",
    "btn_text": "All Nine Monthly Results",
    "header": "Nine Monthly Results Snapshot (Consolidated) - Dec'25",
    "rhs": [
      {
        "prefix": "Net Sales ",
        "suffix": "YoY Growth in nine months ended Dec 2025 is 15.36% vs -0.25% in Dec 2024",
        "dir": 1
      },
      {
        "prefix": "Consolidated Net Profit ",
        "suffix": "YoY Growth in nine months ended Dec 2025 is -28.14% vs 22.96% in Dec 2024",
        "dir": -1
      }
    ],
    "table": {
      "header": [
        "Dec'25",
        "Dec'24",
        "Change(%)"
      ],
      "body": [
        {
          "field": "Net Sales",
          "val1": "534.75",
          "val2": "463.56",
          "chgp": "15.36%",
          "chgp_class": "positive"
        },
        {
          "field": "Operating Profit (PBDIT) excl Other Income",
          "val1": "50.25",
          "val2": "48.07",
          "chgp": "4.54%",
          "chgp_class": "positive"
        },
        {
          "field": "Interest",
          "val1": "29.63",
          "val2": "23.30",
          "chgp": "27.17%",
          "chgp_class": "negative"
        },
        {
          "field": "Exceptional Items",
          "val1": "6.28",
          "val2": "-3.53",
          "chgp": "277.90%",
          "chgp_class": "positive"
        },
        {
          "field": "Consolidate Net Profit",
          "val1": "8.12",
          "val2": "11.30",
          "chgp": "-28.14%",
          "chgp_class": "negative"
        },
        {
          "field": "Operating Profit Margin (Excl OI)",
          "val1": "9.40%",
          "val2": "10.37%",
          "chgp": "-0.97%",
          "chgp_class": "negative"
        }
      ]
    }
  },
  {
    "link": "annual",
    "btn_text": "All Annual Results",
    "header": "Annual Results Snapshot (Consolidated) - Mar'26",
    "rhs": [
      {
        "prefix": "Net Sales ",
        "suffix": "YoY Growth in year ended Mar 2026 is 25.13% vs 0.67% in Mar 2025",
        "dir": 1
      },
      {
        "prefix": "Consolidated Net Profit ",
        "suffix": "YoY Growth in year ended Mar 2026 is 116.05% vs 12.43% in Mar 2025",
        "dir": 1
      }
    ],
    "table": {
      "header": [
        "Mar'26",
        "Mar'25",
        "Change(%)"
      ],
      "body": [
        {
          "field": "Net Sales",
          "val1": "824.05",
          "val2": "658.55",
          "chgp": "25.13%",
          "chgp_class": "positive"
        },
        {
          "field": "Operating Profit (PBDIT) excl Other Income",
          "val1": "78.70",
          "val2": "68.28",
          "chgp": "15.26%",
          "chgp_class": "positive"
        },
        {
          "field": "Interest",
          "val1": "40.01",
          "val2": "32.17",
          "chgp": "24.37%",
          "chgp_class": "negative"
        },
        {
          "field": "Exceptional Items",
          "val1": "21.84",
          "val2": "-3.79",
          "chgp": "676.25%",
          "chgp_class": "positive"
        },
        {
          "field": "Consolidate Net Profit",
          "val1": "38.50",
          "val2": "17.82",
          "chgp": "116.05%",
          "chgp_class": "positive"
        },
        {
          "field": "Operating Profit Margin (Excl OI)",
          "val1": "9.55%",
          "val2": "10.37%",
          "chgp": "-0.82%",
          "chgp_class": "negative"
        }
      ]
    }
  }
]

Quarterly Results Snapshot (Consolidated) - Jun'26 - QoQstock-summary

Jun'26
Mar'26
Change(%)
Net Sales
265.47
289.31
-8.24%
Operating Profit (PBDIT) excl Other Income
19.17
28.46
-32.64%
Interest
11.65
10.37
12.34%
Exceptional Items
0.00
15.56
-100.00%
Consolidate Net Profit
1.88
30.41
-93.82%
Operating Profit Margin (Excl OI)
7.22%
9.84%
-2.62%
Values in Rs Cr.
Direction Arrows
Net Sales

QoQ Growth in quarter ended Jun 2026 is -8.24% vs 38.12% in Mar 2026

Direction Arrows
Consolidated Net Profit

QoQ Growth in quarter ended Jun 2026 is -93.82% vs 529.61% in Mar 2026

Half Yearly Results Snapshot (Consolidated) - Sep'25stock-summary

Sep'25
Sep'24
Change(%)
Net Sales
325.29
307.49
5.79%
Operating Profit (PBDIT) excl Other Income
30.57
31.20
-2.02%
Interest
19.24
14.51
32.60%
Exceptional Items
6.28
0.00
Consolidate Net Profit
3.29
10.28
-68.00%
Operating Profit Margin (Excl OI)
9.40%
10.15%
-0.75%
Values in Rs Cr.
Direction Arrows
Net Sales

Growth in half year ended Sep 2025 is 5.79% vs -1.12% in Sep 2024

Direction Arrows
Consolidated Net Profit

Growth in half year ended Sep 2025 is -68.00% vs 108.94% in Sep 2024

Nine Monthly Results Snapshot (Consolidated) - Dec'25stock-summary

Dec'25
Dec'24
Change(%)
Net Sales
534.75
463.56
15.36%
Operating Profit (PBDIT) excl Other Income
50.25
48.07
4.54%
Interest
29.63
23.30
27.17%
Exceptional Items
6.28
-3.53
277.90%
Consolidate Net Profit
8.12
11.30
-28.14%
Operating Profit Margin (Excl OI)
9.40%
10.37%
-0.97%
Values in Rs Cr.
Direction Arrows
Net Sales

YoY Growth in nine months ended Dec 2025 is 15.36% vs -0.25% in Dec 2024

Direction Arrows
Consolidated Net Profit

YoY Growth in nine months ended Dec 2025 is -28.14% vs 22.96% in Dec 2024

Annual Results Snapshot (Consolidated) - Mar'26stock-summary

Mar'26
Mar'25
Change(%)
Net Sales
824.05
658.55
25.13%
Operating Profit (PBDIT) excl Other Income
78.70
68.28
15.26%
Interest
40.01
32.17
24.37%
Exceptional Items
21.84
-3.79
676.25%
Consolidate Net Profit
38.50
17.82
116.05%
Operating Profit Margin (Excl OI)
9.55%
10.37%
-0.82%
Values in Rs Cr.
Direction Arrows
Net Sales

YoY Growth in year ended Mar 2026 is 25.13% vs 0.67% in Mar 2025

Direction Arrows
Consolidated Net Profit

YoY Growth in year ended Mar 2026 is 116.05% vs 12.43% in Mar 2025

stock-summaryCompany CV
About Autoline Industries Ltd stock-summary
stock-summary
Autoline Industries Ltd
Micro Cap
Auto Components & Equipments
Autoline Industries Limited was initially established as a partnership firm as 'Autoline Pressings' in January, 1995. The Company was then incorporated on December 16, 1996 as a Private Limited Company as 'Autoline Stampings Private Limited'. In December 1996, the Company was converted into private limited company as 'Autoline Industries Private Limited' and in 2006 was changed to Autoline Industries Limited'.
Company Coordinates stock-summary
Company Details
Survey Nos 313 314 320 - 323, Nanewarkadi Chakan Taluka Khed Pune Maharashtra : 410501
stock-summary
Tel: 91-2135-664865/6
stock-summary
investorservices@autolineind.com
Registrar Details
Link Intime India Pvt Ltd, Block No 202, 2nd Floor, Akshay Complex, Near Ganesh Temple, Off Dhole Patil Road , Pune