
Compare Avalon Tech with Similar Stocks
Stock DNA
Other Electrical Equipment
INR 11,482 Cr (Small Cap)
104.00
54
0.00%
0.10
15.65%
15.59
Total Returns (Price + Dividend) 
Avalon Tech for the last several years.
Risk Adjusted Returns v/s
Returns Beta

News

Avalon Technologies Ltd is Rated Buy
Avalon Technologies Ltd is rated 'Buy' by MarketsMOJO, with this rating last updated on 09 April 2026. However, the analysis and financial metrics discussed here reflect the stock's current position as of 15 June 2026, providing investors with the most up-to-date insights into the company’s performance and outlook.
Read full news article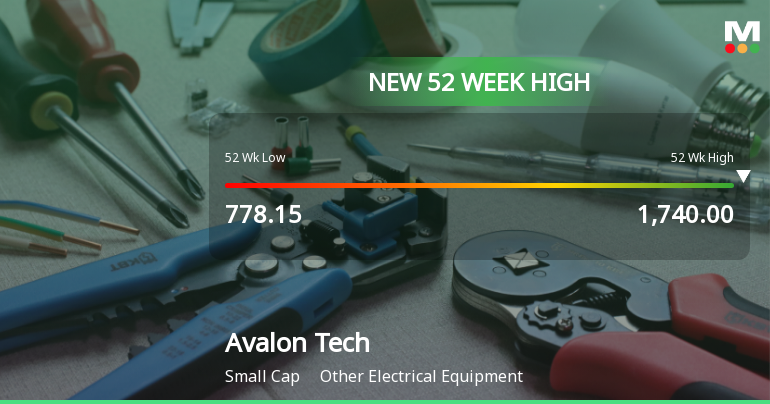
Avalon Technologies Ltd Hits New 52-Week High of Rs 1740 on Back of Strong Technical Signals
From Rs 778.15 to Rs 1740 in just one year, Avalon Technologies Ltd has more than doubled, surging 107.91% while the Sensex declined 5.55% over the same period. This remarkable rally culminated in a fresh 52-week and all-time high of Rs 1740 on 15 Jun 2026, underscoring the stock’s robust momentum and technical strength.
Read full news article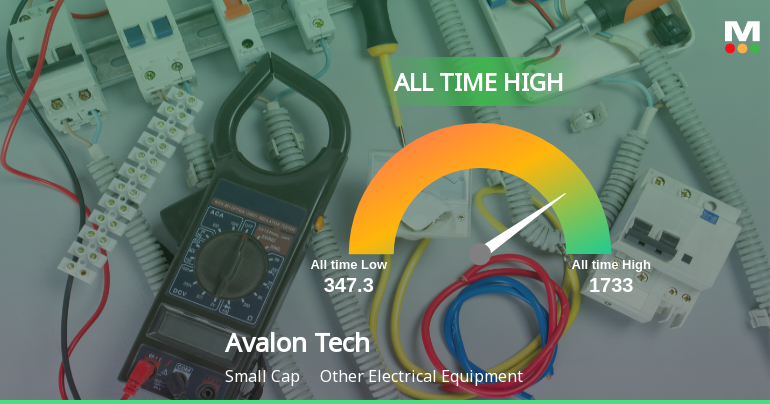
Avalon Technologies Ltd Hits All-Time High of Rs 1,733 as Momentum Builds Across Timeframes
Extending its winning streak to three sessions, Avalon Technologies Ltd surged to a fresh all-time high of Rs 1,733 on 15 Jun 2026, marking a 2.88% intraday gain and continuing its impressive run that has delivered over 13% returns in just three days.
Read full news article Announcements
Announcement under Regulation 30 (LODR)-Analyst / Investor Meet - Intimation
27-May-2026 | Source : BSEPlease find the enclosed Intimation of Investor Meet pursuant to Regulation 30 of SEBI (Listing Obligations and Disclosure Requirements) Regulations 2015.
Announcement under Regulation 30 (LODR)-Analyst / Investor Meet - Intimation
22-May-2026 | Source : BSEPlease find the enclosed Intimation of Investor Meet pursuant to Regulation 30 of SEBI (Listing Obligations and Disclosure Requirements) Regulations 2015.
Compliances-Reg.24(A)-Annual Secretarial Compliance
22-May-2026 | Source : BSEPlease find the enclosed Annual Secretarial Compliance Report for the Financial Year ended March 31 2026 pursuant to Regulation 24A (2) of the SEBI (Listing Obligations and Disclosure Requirements) Regulations 2015.
Corporate Actions

No Upcoming Board Meetings

No Dividend history available

No Splits history available

No Bonus history available

No Rights history available
Quality key factors
Valuation key factors
Technicals key factors
 Technical Indicator Scale: Bearish, Mildly Bearish, Sideways, Mildly Bullish, Bullish Turned
 Shareholding Snapshot : Mar 2026
Shareholding Compare (%holding)
Promoters
None
Held by 16 Schemes (22.34%)
Held by 66 FIIs (6.42%)
Kunhamed Bicha (21.61%)
Nippon Life India Trustee Ltd-a/c Nippon India Small Cap Fund (5.81%)
10.11%
Quarterly Results Snapshot (Consolidated) - Mar'26 - QoQ

QoQ Growth in quarter ended Mar 2026 is 14.93% vs 9.17% in Dec 2025

QoQ Growth in quarter ended Mar 2026 is 26.23% vs 30.50% in Dec 2025
Half Yearly Results Snapshot (Consolidated) - Sep'25
Growth in half year ended Sep 2025 is 48.74% vs 8.81% in Sep 2024
Growth in half year ended Sep 2025 is 158.34% vs 5.71% in Sep 2024
Nine Monthly Results Snapshot (Consolidated) - Dec'25
YoY Growth in nine months ended Dec 2025 is 48.72% vs 16.14% in Dec 2024
YoY Growth in nine months ended Dec 2025 is 83.32% vs 87.19% in Dec 2024
Annual Results Snapshot (Consolidated) - Mar'26
YoY Growth in year ended Mar 2026 is 45.99% vs 26.63% in Mar 2025
YoY Growth in year ended Mar 2026 is 78.04% vs 126.65% in Mar 2025
About Avalon Technologies Ltd

Company Coordinates


