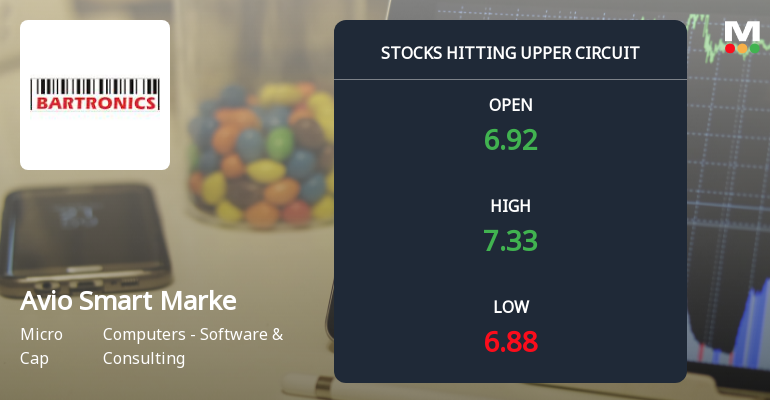
Avio Smart Marke

  • Market Cap: Micro Cap
  • Industry: Computers - Software & Consulting
  • ISIN: INE855F01042
  • NSEID: ASMS
  • BSEID: 532694
INR
6.90
0.00 (0.00%)
BSENSE

Sep 11, 03:30 PM

BSE+NSE Vol: 1.67 lacs

  • Price Points
  • Score
  • Mojo Parameters
  • Total Return
  • News and Corporate Actions
  • Key factors
  • Shareholding
  • Financials
  • CompanyCV
stock-summaryPrice Point
High/Low

1Day

52 Week

Valuation
Technical
Day's Volume

CASH

1.67 lacs (-11.40%) Volume

Shareholding (Jun 2026)

FII

1.49%

Held by 9 FIIs

DII

0.22%

Held by 1 DIIs

Promoter

65.82%

Why is Avio Smart Market Stack Limited falling/rising?

06-Sep-2026

As of 05-Sep, Avio Smart Market Stack Limited's stock price is at 7.05, down 1.26%, and has significantly underperformed its sector and the benchmark Sensex over the past year. The stock shows a bearish trend with declining moving averages and a substantial drop in investor participation.

As of 05-Sep, Avio Smart Market Stack Limited's stock price is falling, currently at 7.05, which reflects a change of -0.09 or -1.26%. The stock has underperformed its sector by 1.27% today, indicating a weaker performance relative to its peers. Over the past week, while the stock has increased by 1.15%, it has shown a decline of 2.49% over the past month and a significant year-to-date drop of 40.81%. <BR><BR>Additionally, the stock's performance over the past year is concerning, with a decline of 42.35%, compared to a much smaller drop of 5.21% in the benchmark Sensex. The stock's moving averages indicate that it is currently lower than the 100-day and 200-day moving averages, which can signal a bearish trend. Furthermore, there has been a notable decrease in investor participation, with delivery volume falling by 72.84% against the 5-day average, suggesting reduced interest from investors. <BR><BR>Overall, these factors contribute to the stock's declining price, reflecting a combination of poor performance metrics and diminishing investor engagement.

View full answer

Should I buy, sell or hold Avio Smart Market Stack Limited?

02-Sep-2026

Who are in the management team of Avio Smart Marke?

01-Sep-2026

The management team of Avio Smart Marke consists of A B S Reddy (Director), Gaddam Varshitha (Independent Director), and Ashwani Singh Bisht (Company Secretary and Compliance Officer).

The management team of Avio Smart Marke includes the following individuals:<BR><BR>1. A B S Reddy - Director<BR>2. Gaddam Varshitha - Independent Director<BR>3. Ashwani Singh Bisht - Company Secretary and Compliance Officer<BR><BR>If you need more information about their roles or the company, feel free to ask!

View full answer

What does Avio Smart Marke do?

01-Sep-2026

Avio Smart Market Stack Limited, a Micro Cap company in the software and consulting industry, reported net sales of 12 Cr and a net profit of 1 Cr for June 2026. The company, formerly known as Bartronics India Limited, has a market cap of INR 211 Cr and a P/E ratio of 37.00.

Overview:<BR>Avio Smart Market Stack Limited operates in the Computers - Software & Consulting industry and is categorized as a Micro Cap company.<BR><BR>History:<BR>The company was incorporated in 1990 as Super Bar Tronics Private Limited, later changing its name to Super Bartronics Limited and converting to a Public Limited Company in 1995. It was renamed Bartronics India Limited in 1996. The latest quarterly results reported net sales and net profit for June 2026.<BR><BR>Financial Snapshot:<BR>- Net Sales: 12 Cr (Quarterly Results - Jun 2026)<BR>- Net Profit: 1 Cr (Quarterly Results - Jun 2026)<BR>- Market-cap: INR 211 Cr (Micro Cap)<BR><BR>Key Metrics:<BR>- P/E: 37.00<BR>- Industry P/E: 21<BR>- Dividend Yield: 0.00%<BR>- Debt Equity: -0.04<BR>- Return on Equity: 23.61%<BR>- Price to Book: 7.24<BR><BR>Contact Details:<BR>Address: Survey No 351 Raj Bollaram vil, Medchal Mandal Ranga Reddy Dist Telangana : 501401<BR>Website: http://www.bartronicsindia.com

View full answer

Who are the peers of the Avio Smart Marke?

01-Sep-2026

Avio Smart Marke's peers include ACE Alpha Tech, Equippp Social, CapitalNumbers, Adcounty Media, P.E. Analytics, All E Tech, Fidel Softech, and Esconet. Avio has below average management risk and capital structure, with an average growth rate and a 1-year return of -42.83%.

Peers: The peers of Avio Smart Marke are ACE Alpha Tech, Equippp Social, CapitalNumbers, Adcounty Media, P.E. Analytics, All E Tech, Fidel Softech, and Esconet.<BR><BR>Quality Snapshot: Excellent management risk is observed at ACE Alpha Tech, Adcounty Media, All E Tech, and Fidel Softech, while Average management risk is found at Equippp Social, CapitalNumbers, and P.E. Analytics, and the rest. Below Average management risk is noted for Avio Smart Marke. Growth is Excellent at Equippp Social and the rest, while Average growth is seen at Avio Smart Marke, All E Tech, and the rest. Below Average growth is present at ACE Alpha Tech, CapitalNumbers, and P.E. Analytics, while Good growth is noted at Adcounty Media and Fidel Softech, and the rest. Excellent capital structure is observed at ACE Alpha Tech, CapitalNumbers, P.E. Analytics, All E Tech, Fidel Softech, and the rest, while Average capital structure is found at Equippp Social, and Below Average capital structure is noted for Avio Smart Marke.<BR><BR>Return Snapshot: The peer with the highest 1-year return is Equippp Social at 23.46%, while the peer with the lowest is Adcounty Media at -60.18%. Avio Smart Marke's 1-year return is -42.83%, which is significantly lower than Equippp Social's return and higher than Adcounty Media's. Additionally, the six-month return is negative for Avio Smart Marke, Adcounty Media, and CapitalNumbers.

View full answer

How big is Avio Smart Marke?

01-Sep-2026

As of 31st August, Avio Smart Market Stack Limited has a market capitalization of 211.00 Cr, with recent net sales of 103.53 Cr and a net profit of 5.90 Cr. The balance sheet as of March 2023 shows shareholder's funds of 528.23 Cr and total assets of 748.20 Cr.

As of 31st August, Avio Smart Market Stack Limited has a market capitalization of 211.00 Cr, classified as a Micro Cap.<BR><BR>In the latest four quarters, the company reported Net Sales of 103.53 Cr and a Net Profit of 5.90 Cr.<BR><BR>The latest annual period for the balance sheet is March 2023, showing Shareholder's Funds of 528.23 Cr and Total Assets of 748.20 Cr.

View full answer

Are Bartronics India Ltd latest results good or bad?

30-May-2026

Bartronics India Ltd's latest results show a return to profitability with a net profit of ₹2.09 crores and impressive year-on-year revenue growth of 199.83%. However, a significant quarter-on-quarter revenue decline of 28.86%, low return on equity, and a 52.74% drop in stock price over the past year raise concerns about the sustainability of this performance, making the overall outlook more negative than positive.

Bartronics India Ltd's latest results present a mixed picture. On one hand, the company has returned to profitability, reporting a net profit of ₹2.09 crores for Q4 FY26, which is a positive development after years of losses. Additionally, the company achieved impressive year-on-year revenue growth of 199.83%, indicating some momentum in its business operations.<BR><BR>However, there are significant concerns that overshadow these positives. The quarter-on-quarter revenue declined sharply by 28.86%, which raises questions about the sustainability of its recent profitability. This decline follows a substantial revenue increase in the previous quarter, suggesting volatility in order execution or project completion, which is common in the software consulting sector.<BR><BR>Moreover, the company's return on equity (ROE) remains low at 13.45%, and its average ROE over time has been just 2.78%, indicating poor capital efficiency. The stock has also faced severe pressure, dropping 52.74% over the past year, significantly underperforming the broader market.<BR><BR>In summary, while Bartronics India has made strides towards profitability, the volatility in revenue, weak return metrics, and substantial stock underperformance suggest that the overall results are more concerning than encouraging. Investors should be cautious and consider these factors when evaluating the company's prospects.

View full answer

When is the next results date for Bartronics India Ltd?

26-May-2026

The next results date for Bartronics India Ltd is 29 May 2026.

The next results date for Bartronics India Ltd is scheduled for 29 May 2026.

View full answer

How has been the historical performance of Bartronics India?

17-Nov-2025

Bartronics India has experienced a decline in net sales from INR 76.17 crore in March 2019 to INR 52.63 crore in March 2023, but has significantly improved profitability, turning a loss of INR 66.34 crore in March 2019 into a profit of INR 412.40 crore in March 2023. Total assets decreased from INR 1,466.51 crore in March 2018 to INR 748.20 crore in March 2023, with negative cash flow from operating activities reported in March 2023.

Answer:<BR>The historical performance of Bartronics India shows significant fluctuations in key financial metrics over the years.<BR><BR>Breakdown:<BR>Bartronics India's net sales have declined from INR 76.17 crore in March 2019 to INR 52.63 crore in March 2023, indicating a downward trend in revenue. The total operating income followed a similar pattern, decreasing from INR 85.27 crore in March 2017 to INR 52.63 crore in March 2023. The company experienced a notable recovery in profit before tax, which shifted from a loss of INR 74.09 crore in March 2019 to a profit of INR 431.87 crore in March 2023. This turnaround is reflected in the profit after tax, which improved from a loss of INR 66.34 crore in March 2019 to a profit of INR 412.40 crore in March 2023. The company's total assets decreased from INR 1,466.51 crore in March 2018 to INR 748.20 crore in March 2023, while total liabilities also saw a reduction from INR 1,597.68 crore in March 2022 to INR 748.20 crore in March 2023. Cash flow from operating activities turned negative in March 2023 at INR -4.00 crore, contrasting with positive cash flows in previous years. Overall, Bartronics India has shown a significant recovery in profitability despite challenges in revenue and asset management.

View full answer

Who are the top shareholders of the Bartronics India?

17-Jul-2025

The top shareholders of Bartronics India include Kinex India Private Limited with 75.0% of shares, followed by seven foreign institutional investors holding 3.97%, and Ebisu Global Opportunities Fund Limited as the largest public shareholder with 1.6%. Individual investors collectively own 16.32% of the company's shares.

The top shareholders of Bartronics India include Kinex India Private Limited, which holds a significant 75.0% of the shares, making it the largest promoter. Additionally, there are seven foreign institutional investors (FIIs) that collectively hold 3.97% of the shares. The highest public shareholder is Ebisu Global Opportunities Fund Limited, with a holding of 1.6%. Individual investors also have a notable presence, owning 16.32% of the company's shares.

View full answer

Is Bartronics India overvalued or undervalued?

09-Jun-2025

As of April 25, 2023, Bartronics India is considered risky and overvalued, with a PE ratio of 431.28 and a year-to-date return of -21.80%, significantly underperforming compared to its peers and the Sensex.

As of 25 April 2023, the valuation grade for Bartronics India has moved from does not qualify to risky, indicating a shift in perception regarding its financial health. The company is currently overvalued, with a staggering PE ratio of 431.28 and an EV to EBITDA of -429.19, which suggests significant concerns about profitability. Additionally, the Price to Book Value stands at 15.68, further highlighting the disconnect between market valuation and underlying asset value.<BR><BR>When compared to peers, Bartronics India shows a stark contrast, with MMTC having a PE ratio of 119.39 and Optiemus Infra at 82.35, both of which are significantly lower and indicate a more reasonable valuation. The company has underperformed in recent months, with a year-to-date return of -21.80% compared to the Sensex's positive return of 5.61%, reinforcing the notion that Bartronics India is not only overvalued but also struggling to deliver shareholder value in the current market environment.

View full answer

What is the technical trend for Bartronics India?

09-Jun-2025

As of June 5, 2025, Bartronics India is in a bearish trend with moderate strength, indicated by bearish daily moving averages, Bollinger Bands, and On-Balance Volume, despite a mildly bullish weekly MACD.

As of 5 June 2025, the technical trend for Bartronics India has changed from mildly bearish to bearish. The current stance is bearish with a moderate strength. Key indicators driving this include the daily moving averages indicating a bearish trend, along with both weekly and monthly Bollinger Bands also showing bearish signals. The MACD on a weekly basis is mildly bullish, but the monthly MACD is mildly bearish, which adds to the overall bearish sentiment. Additionally, the On-Balance Volume (OBV) is bearish on both weekly and monthly time frames, reinforcing the bearish outlook. The Dow Theory also reflects a mildly bearish stance on both weekly and monthly charts. Overall, the combination of these indicators suggests a prevailing bearish trend for Bartronics India.

View full answer

Has Bartronics India declared dividend?

06-Jun-2025

Bartronics India Ltd has declared a 10% dividend, amounting to ₹1 per share, but the dividend yield is 0%. While the company has shown significant price returns over the past 3 to 5 years, the dividend has not contributed to returns in recent periods.

Bartronics India Ltd has declared a 10% dividend.<BR><BR>Dividend Details:<BR>- Percentage announced: 10%<BR>- Amount per share: 1 per share<BR>- Ex-date: 21 Sep 11<BR><BR>Dividend Yield: 0%<BR><BR>Total Returns by Period:<BR>In the last 6 months, the price return was -30.23%, the dividend return was 0%, resulting in a total return of -30.23%.<BR><BR>Over the past year, the price return was -25.59%, the dividend return was 0%, leading to a total return of -25.59%.<BR><BR>In the 2-year period, the price return was 62.63%, the dividend return was 0%, culminating in a total return of 62.63%.<BR><BR>For the 3-year period, the price return was 194.98%, with a dividend return of 0%, resulting in a total return of 194.98%.<BR><BR>In the 4-year span, the price return was 307.51%, the dividend return was 0%, leading to a total return of 307.51%.<BR><BR>Finally, over the last 5 years, the price return was 719.77%, with a dividend return of 0%, resulting in a total return of 719.77%.<BR><BR>Overall, while Bartronics India Ltd has declared a dividend, the dividend yield is 0%, indicating that the dividend has not contributed to returns in recent periods. The total returns show significant growth over longer periods, particularly in the 3 to 5-year range, despite the lack of dividends in those periods.

View full answer
iScoreScore
Click here to find our call on this stock
Strong Sell
Sell
Hold
Buy
Strong Buy

Dashboard

1

Weak Long Term Fundamental Strength with an average Return on Equity (ROE) of 5.78%

  • Poor long term growth as Net Sales has grown by an annual rate of 10.90% over the last 5 years
  • Company's ability to service its debt is weak with a poor EBIT to Interest (avg) ratio of 0.77
2

Reducing Promoter Confidence

3

Below par performance in long term as well as near term

stock-summaryMojo Parameters

Mojo Parameters

Loading Valuation Snapshot...

Stock DNA

stock-summary
Industry

Computers - Software & Consulting

stock-summary
Market cap

INR 213 Cr (Micro Cap)

stock-summary
P/E

36.00

stock-summary
Industry P/E

22

stock-summary
Dividend Yield

0.00%

stock-summary
Debt Equity

-0.04

stock-summary
Return on Equity

23.61%

stock-summary
Price to Book

7.18

Revenue and Profits:
Net Sales:
12 Cr
(Quarterly Results - Jun 2026)
Net Profit:
1 Cr
stock-summaryTotal Returns
Total Returns (Price + Dividend) stock-summary
Dividend Yield (0%)
TimePeriod
Price Return
Dividend Return
Total Return
3 Months
-3.23%
0%
-3.23%
6 Months
-22.03%
0%
-22.03%
1 Year
-58.11%
0%
-58.11%
2 Years
-63.04%
0%
-63.04%
3 Years
-37.27%
0%
-37.27%
4 Years
50.98%
0%
50.98%
5 Years
146.43%
0%
146.43%

Latest dividend: 1 per share ex-dividend date: Sep-21-2011

Risk Adjusted Returns v/s stock-summary
Returns Beta
Icon
Beta has not been calculated since enough price history is not available
stock-summaryNews & Corporate Actions

News

Announcements stock-summary

Announcement under Regulation 30 (LODR)-Newspaper Publication

05-Sep-2026 | Source : BSE

Please find the enclosed disclosure for your information.

Reg. 34 (1) Annual Report.

04-Sep-2026 | Source : BSE

Please find the enclosed 34th Annual Report.

Corporate Action- Fix Book Closure For 34Th Annual General Meeting.

04-Sep-2026 | Source : BSE

Please find the enclosed intimation for your reference.

Corporate Actions stock-summary

stock-summary
BOARD MEETING

No Upcoming Board Meetings

stock-summary
DIVIDEND

Avio Smart Market Stack Limited has declared 10% dividend, ex-date: 21 Sep 11

stock-summary
SPLITS

No Splits history available

stock-summary
BONUS

No Bonus history available

stock-summary
RIGHTS

No Rights history available

stock-summaryKey Factors

Quality key factors stock-summary

Factor
Value
Sales Growth (5y)
10.90%
EBIT Growth (5y)
38.11%
EBIT to Interest (avg)
0.77
Debt to EBITDA (avg)
29.22
Net Debt to Equity (avg)
-0.04
Sales to Capital Employed (avg)
1.27
Tax Ratio
6.51%
Dividend Payout Ratio
0
Pledged Shares
0
Institutional Holding
1.71%
ROCE (avg)
-3.13%
ROE (avg)
5.78%

Valuation key factors

Factor
Value
P/E Ratio
36
Industry P/E
22
Price to Book Value
7.08
EV to EBIT
34.08
EV to EBITDA
33.01
EV to Capital Employed
7.34
EV to Sales
1.95
PEG Ratio
0.02
Dividend Yield
NA
ROCE (Latest)
16.41%
ROE (Latest)
23.61%

Technicals key factors

Indicator
Weekly
Monthly
MACD
Mildly Bullish
Bearish
RSI
No Signal
No Signal
Bollinger Bands
Bearish
Bearish
Moving Averages
Bearish (Daily)
KST
Mildly Bullish
Bearish
Dow Theory
Mildly Bearish
No Trend
OBV
Mildly Bullish
No Trend
stock-summary Technical Indicator Scale: Bearish, Mildly Bearish, Sideways, Mildly Bullish, Bullish  Turned 
stock-summaryShareholding
Shareholding Snapshot : Jun 2026stock-summary
Shareholding Compare (%holding) stock-summary
Majority shareholders

Promoters

Pledged Promoter Holdings

None

Mutual Funds

Held by 0 Schemes

FIIs

Held by 9 FIIs (1.49%)

Promoter with highest holding

Kinex India Private Limited (67.5%)

Highest Public shareholder

None

Individual Investors Holdings

26.32%

stock-summaryFinancial
[
  {
    "link": "quarterly",
    "btn_text": "All Quarterly Results",
    "header": "Quarterly Results Snapshot (Standalone) - Jun'26 - QoQ",
    "rhs": [
      {
        "prefix": "Net Sales ",
        "suffix": "QoQ Growth in quarter ended Jun 2026 is -65.19% vs -28.86% in Mar 2026",
        "dir": -1
      },
      {
        "prefix": "Standalone Net Profit ",
        "suffix": "QoQ Growth in quarter ended Jun 2026 is -27.75% vs -14.69% in Mar 2026",
        "dir": -1
      }
    ],
    "table": {
      "header": [
        "Jun'26",
        "Mar'26",
        "Change(%)"
      ],
      "body": [
        {
          "field": "Net Sales",
          "val1": "11.97",
          "val2": "34.39",
          "chgp": "-65.19%",
          "chgp_class": "negative"
        },
        {
          "field": "Operating Profit (PBDIT) excl Other Income",
          "val1": "0.71",
          "val2": "2.32",
          "chgp": "-69.40%",
          "chgp_class": "negative"
        },
        {
          "field": "Interest",
          "val1": "0.27",
          "val2": "0.07",
          "chgp": "285.71%",
          "chgp_class": "negative"
        },
        {
          "field": "Exceptional Items",
          "val1": "0.00",
          "val2": "0.05",
          "chgp": "-100.00%",
          "chgp_class": "negative"
        },
        {
          "field": "Standalone Net Profit",
          "val1": "1.51",
          "val2": "2.09",
          "chgp": "-27.75%",
          "chgp_class": "negative"
        },
        {
          "field": "Operating Profit Margin (Excl OI)",
          "val1": "5.93%",
          "val2": "6.75%",
          "chgp": "-0.82%",
          "chgp_class": "negative"
        }
      ]
    }
  },
  {
    "link": "half-yearly",
    "btn_text": "All Half Yearly Results",
    "header": "Half Yearly Results Snapshot (Standalone) - Sep'25",
    "rhs": [
      {
        "prefix": "Net Sales ",
        "suffix": " Growth in half year ended Sep 2025 is -5.31% vs -8.53% in Sep 2024",
        "dir": 1
      },
      {
        "prefix": "Standalone Net Profit ",
        "suffix": " Growth in half year ended Sep 2025 is 27.19% vs 315.09% in Sep 2024",
        "dir": -1
      }
    ],
    "table": {
      "header": [
        "Sep'25",
        "Sep'24",
        "Change(%)"
      ],
      "body": [
        {
          "field": "Net Sales",
          "val1": "21.23",
          "val2": "22.42",
          "chgp": "-5.31%",
          "chgp_class": "negative"
        },
        {
          "field": "Operating Profit (PBDIT) excl Other Income",
          "val1": "-0.11",
          "val2": "0.17",
          "chgp": "-164.71%",
          "chgp_class": "negative"
        },
        {
          "field": "Interest",
          "val1": "0.01",
          "val2": "0.00",
          "chgp": "",
          "chgp_class": "neutral"
        },
        {
          "field": "Exceptional Items",
          "val1": "0.00",
          "val2": "0.80",
          "chgp": "-100.00%",
          "chgp_class": "negative"
        },
        {
          "field": "Standalone Net Profit",
          "val1": "1.45",
          "val2": "1.14",
          "chgp": "27.19%",
          "chgp_class": "positive"
        },
        {
          "field": "Operating Profit Margin (Excl OI)",
          "val1": "-0.52%",
          "val2": "0.76%",
          "chgp": "-1.28%",
          "chgp_class": "negative"
        }
      ]
    }
  },
  {
    "link": "nine-monthly",
    "btn_text": "All Nine Monthly Results",
    "header": "Nine Monthly Results Snapshot (Standalone) - Dec'25",
    "rhs": [
      {
        "prefix": "Net Sales ",
        "suffix": "YoY Growth in nine months ended Dec 2025 is 123.48% vs -14.55% in Dec 2024",
        "dir": 1
      },
      {
        "prefix": "Standalone Net Profit ",
        "suffix": "YoY Growth in nine months ended Dec 2025 is 381.48% vs 237.29% in Dec 2024",
        "dir": 1
      }
    ],
    "table": {
      "header": [
        "Dec'25",
        "Dec'24",
        "Change(%)"
      ],
      "body": [
        {
          "field": "Net Sales",
          "val1": "69.57",
          "val2": "31.13",
          "chgp": "123.48%",
          "chgp_class": "positive"
        },
        {
          "field": "Operating Profit (PBDIT) excl Other Income",
          "val1": "2.49",
          "val2": "-0.20",
          "chgp": "1,345.00%",
          "chgp_class": "positive"
        },
        {
          "field": "Interest",
          "val1": "0.01",
          "val2": "0.00",
          "chgp": "",
          "chgp_class": "neutral"
        },
        {
          "field": "Exceptional Items",
          "val1": "0.00",
          "val2": "0.80",
          "chgp": "-100.00%",
          "chgp_class": "negative"
        },
        {
          "field": "Standalone Net Profit",
          "val1": "3.90",
          "val2": "0.81",
          "chgp": "381.48%",
          "chgp_class": "positive"
        },
        {
          "field": "Operating Profit Margin (Excl OI)",
          "val1": "3.58%",
          "val2": "-0.64%",
          "chgp": "4.22%",
          "chgp_class": "positive"
        }
      ]
    }
  },
  {
    "link": "annual",
    "btn_text": "All Annual Results",
    "header": "Annual Results Snapshot (Consolidated) - Mar'26",
    "rhs": [
      {
        "prefix": "Net Sales ",
        "suffix": "YoY Growth in year ended Mar 2026 is 159.64% vs -23.92% in Mar 2025",
        "dir": 1
      },
      {
        "prefix": "Consolidated Net Profit ",
        "suffix": "YoY Growth in year ended Mar 2026 is 239.43% vs -99.58% in Mar 2025",
        "dir": 1
      }
    ],
    "table": {
      "header": [
        "Mar'26",
        "Mar'25",
        "Change(%)"
      ],
      "body": [
        {
          "field": "Net Sales",
          "val1": "103.96",
          "val2": "40.04",
          "chgp": "159.64%",
          "chgp_class": "positive"
        },
        {
          "field": "Operating Profit (PBDIT) excl Other Income",
          "val1": "4.80",
          "val2": "-0.30",
          "chgp": "1,700.00%",
          "chgp_class": "positive"
        },
        {
          "field": "Interest",
          "val1": "0.08",
          "val2": "0.01",
          "chgp": "700.00%",
          "chgp_class": "negative"
        },
        {
          "field": "Exceptional Items",
          "val1": "0.00",
          "val2": "2.06",
          "chgp": "-100.00%",
          "chgp_class": "negative"
        },
        {
          "field": "Consolidate Net Profit",
          "val1": "5.94",
          "val2": "1.75",
          "chgp": "239.43%",
          "chgp_class": "positive"
        },
        {
          "field": "Operating Profit Margin (Excl OI)",
          "val1": "4.62%",
          "val2": "-0.75%",
          "chgp": "5.37%",
          "chgp_class": "positive"
        }
      ]
    }
  }
]

Quarterly Results Snapshot (Standalone) - Jun'26 - QoQstock-summary

Jun'26
Mar'26
Change(%)
Net Sales
11.97
34.39
-65.19%
Operating Profit (PBDIT) excl Other Income
0.71
2.32
-69.40%
Interest
0.27
0.07
285.71%
Exceptional Items
0.00
0.05
-100.00%
Standalone Net Profit
1.51
2.09
-27.75%
Operating Profit Margin (Excl OI)
5.93%
6.75%
-0.82%
Values in Rs Cr.
Direction Arrows
Net Sales

QoQ Growth in quarter ended Jun 2026 is -65.19% vs -28.86% in Mar 2026

Direction Arrows
Standalone Net Profit

QoQ Growth in quarter ended Jun 2026 is -27.75% vs -14.69% in Mar 2026

Half Yearly Results Snapshot (Standalone) - Sep'25stock-summary

Sep'25
Sep'24
Change(%)
Net Sales
21.23
22.42
-5.31%
Operating Profit (PBDIT) excl Other Income
-0.11
0.17
-164.71%
Interest
0.01
0.00
Exceptional Items
0.00
0.80
-100.00%
Standalone Net Profit
1.45
1.14
27.19%
Operating Profit Margin (Excl OI)
-0.52%
0.76%
-1.28%
Values in Rs Cr.
Direction Arrows
Net Sales

Growth in half year ended Sep 2025 is -5.31% vs -8.53% in Sep 2024

Direction Arrows
Standalone Net Profit

Growth in half year ended Sep 2025 is 27.19% vs 315.09% in Sep 2024

Nine Monthly Results Snapshot (Standalone) - Dec'25stock-summary

Dec'25
Dec'24
Change(%)
Net Sales
69.57
31.13
123.48%
Operating Profit (PBDIT) excl Other Income
2.49
-0.20
1,345.00%
Interest
0.01
0.00
Exceptional Items
0.00
0.80
-100.00%
Standalone Net Profit
3.90
0.81
381.48%
Operating Profit Margin (Excl OI)
3.58%
-0.64%
4.22%
Values in Rs Cr.
Direction Arrows
Net Sales

YoY Growth in nine months ended Dec 2025 is 123.48% vs -14.55% in Dec 2024

Direction Arrows
Standalone Net Profit

YoY Growth in nine months ended Dec 2025 is 381.48% vs 237.29% in Dec 2024

Annual Results Snapshot (Consolidated) - Mar'26stock-summary

Mar'26
Mar'25
Change(%)
Net Sales
103.96
40.04
159.64%
Operating Profit (PBDIT) excl Other Income
4.80
-0.30
1,700.00%
Interest
0.08
0.01
700.00%
Exceptional Items
0.00
2.06
-100.00%
Consolidate Net Profit
5.94
1.75
239.43%
Operating Profit Margin (Excl OI)
4.62%
-0.75%
5.37%
Values in Rs Cr.
Direction Arrows
Net Sales

YoY Growth in year ended Mar 2026 is 159.64% vs -23.92% in Mar 2025

Direction Arrows
Consolidated Net Profit

YoY Growth in year ended Mar 2026 is 239.43% vs -99.58% in Mar 2025

stock-summaryCompany CV
About Avio Smart Market Stack Limited stock-summary
stock-summary
Avio Smart Market Stack Limited
Micro Cap
Computers - Software & Consulting
Bartronics India Limited was incorporated as a Private Limited Company by the name of Super Bar Tronics Private Limited on September 10, 1990. Further, the Company changed its name from Super Bar Tronics Private Limited to Super Bartronics Limited and subsequently converted into a Public Limited Company effective from July 27, 1995. The name of the Company was further changed to Bartronics India Limited on January 1, 1996.
Company Coordinates stock-summary
Company Details
Survey No 351 Raj Bollaram vil, Medchal Mandal Ranga Reddy Dist Telangana : 501401
Registrar Details
Bigshare Services Pvt Ltd , 306, Right Wing, Amrutha Ville, Opp. Yasodha Hospital, Raj Bhavan Road, Somajiguda, Hyderabad