
Compare Avonmore Capital with Similar Stocks
Dashboard
With a Operating Losses, the company has a Weak Long Term Fundamental Strength
- Poor long term growth as Operating profit has grown by an annual rate of -4.16%
- PBT LESS OI(Q) At Rs -6.49 cr has Fallen at -171.40%
- PAT(Q) At Rs -9.52 cr has Fallen at -270.3%
- CASH AND CASH EQUIVALENTS(HY) Lowest at Rs 9.76 cr
With ROE of 2, it has a Very Expensive valuation with a 0.7 Price to Book Value
Underperformed the market in the last 1 year
Stock DNA
Non Banking Financial Company (NBFC)
INR 283 Cr (Micro Cap)
36.00
20
0.00%
0.06
2.04%
0.73
Total Returns (Price + Dividend) 
Latest dividend: 0.5 per share ex-dividend date: Sep-03-2007
Risk Adjusted Returns v/s
Returns Beta

News

Avonmore Capital & Management Services Ltd is Rated Strong Sell
Avonmore Capital & Management Services Ltd is rated Strong Sell by MarketsMOJO. This rating was last updated on 27 May 2026. However, all fundamentals, returns, and financial metrics discussed here reflect the stock's current position as of 11 June 2026, providing investors with the latest comprehensive analysis.
Read full news article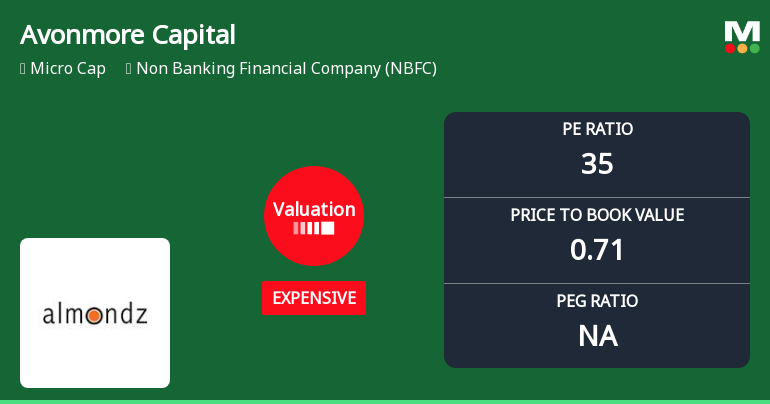
Avonmore Capital & Management Services Ltd: Valuation Shift Signals Increased Price Risk
Avonmore Capital & Management Services Ltd, a micro-cap player in the Non Banking Financial Company (NBFC) sector, has experienced a notable shift in its valuation parameters, moving from a 'very expensive' to an 'expensive' rating. This change, coupled with a recent downgrade in its Mojo Grade to Strong Sell, reflects evolving market perceptions and raises questions about the stock's price attractiveness amid sectoral and peer comparisons.
Read full news article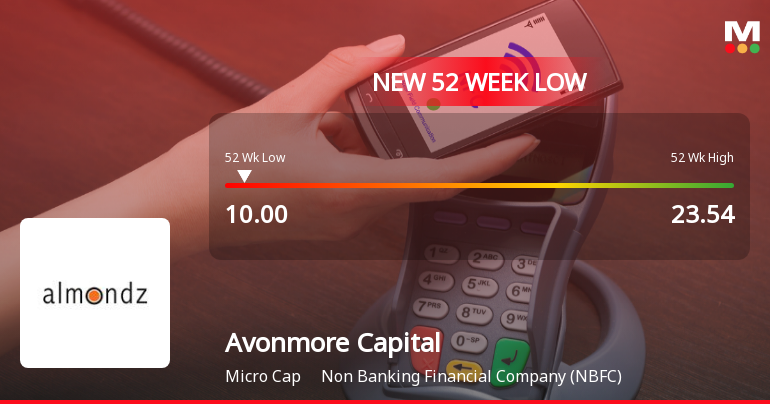
Avonmore Capital & Management Services Ltd Falls to 52-Week Low Amidst Financial Struggles
A sharp decline of nearly 50% over the past year has dragged Avonmore Capital & Management Services Ltd to its lowest price in 52 weeks, reflecting mounting pressures on its financial performance and valuation metrics.
Read full news article Announcements
Compliances-Reg.24(A)-Annual Secretarial Compliance
27-May-2026 | Source : BSEAnnual Secretarial Compliance Report for the Year Ended 31st March 2026
Announcement under Regulation 30 (LODR)-Newspaper Publication
27-May-2026 | Source : BSENewspaper Publication
Outcome Of Board Meeting Held On 26Th May 2026
26-May-2026 | Source : BSEOutcome of Board Meeting
Corporate Actions

No Upcoming Board Meetings

Avonmore Capital & Management Services Ltd has declared 5% dividend, ex-date: 03 Sep 07

Avonmore Capital & Management Services Ltd has announced 1:10 stock split, ex-date: 28 Jun 24

No Bonus history available

Avonmore Capital & Management Services Ltd has announced 5:24 rights issue, ex-date: 12 Dec 24
Quality key factors
Valuation key factors
Technicals key factors
 Technical Indicator Scale: Bearish, Mildly Bearish, Sideways, Mildly Bullish, Bullish Turned
 Shareholding Snapshot : Mar 2026
Shareholding Compare (%holding)
Promoters
None
Held by 0 Schemes
Held by 2 FIIs (0.06%)
Innovative Money Matters Private Limited (33.14%)
Sahi Logistics & Infra Private Limited (5.97%)
29.83%
Quarterly Results Snapshot (Consolidated) - Mar'26 - YoY

YoY Growth in quarter ended Mar 2026 is 7.54% vs 19.19% in Mar 2025
YoY Growth in quarter ended Mar 2026 is -270.30% vs 476.29% in Mar 2025
Half Yearly Results Snapshot (Consolidated) - Sep'25
Growth in half year ended Sep 2025 is -17.69% vs 106.30% in Sep 2024
Growth in half year ended Sep 2025 is -64.41% vs 269.70% in Sep 2024
Nine Monthly Results Snapshot (Consolidated) - Dec'25
YoY Growth in nine months ended Dec 2025 is 5.51% vs 65.32% in Dec 2024
YoY Growth in nine months ended Dec 2025 is -25.62% vs 121.57% in Dec 2024
Annual Results Snapshot (Consolidated) - Mar'26
YoY Growth in year ended Mar 2026 is 5.42% vs 46.31% in Mar 2025
YoY Growth in year ended Mar 2026 is -52.48% vs 1,587.18% in Mar 2025
About Avonmore Capital & Management Services Ltd

Company Coordinates


