
Compare Avro India with Similar Stocks
Dashboard
Weak Long Term Fundamental Strength with a -175.39% CAGR growth in Operating Profits over the last 5 years
- The company has been able to generate a Return on Capital Employed (avg) of 7.25% signifying low profitability per unit of total capital (equity and debt)
Flat results in Mar 26
Risky - Negative Operating Profits
Below par performance in long term as well as near term
Stock DNA
Diversified consumer products
INR 142 Cr (Micro Cap)
31.00
35
0.00%
0.19
4.71%
1.61
Total Returns (Price + Dividend) 
Avro India for the last several years.
Risk Adjusted Returns v/s
Returns Beta

News
Are Avro India Ltd latest results good or bad?
Avro India Ltd's latest financial results for Q4 FY26 reveal a complex picture characterized by revenue growth juxtaposed with declining profitability metrics. The company reported net sales of ₹27.16 crores, reflecting a quarter-on-quarter increase of 9.03% from ₹24.91 crores in Q3 FY26. However, this topline growth is overshadowed by significant challenges in operational efficiency, as evidenced by a sharp decline in operating profit, which fell to ₹0.66 crores, resulting in an operating margin of just 2.43%. This margin represents a notable decrease from 5.95% in Q1 FY26. Net profit for the quarter was ₹0.98 crores, which marked a substantial reduction compared to the previous quarter's net profit of ₹1.36 crores, indicating a negative trend in profitability. The company's reliance on non-operating income is particularly concerning, as it constituted 212.93% of profit before tax, suggesting that the ope...
Read full news article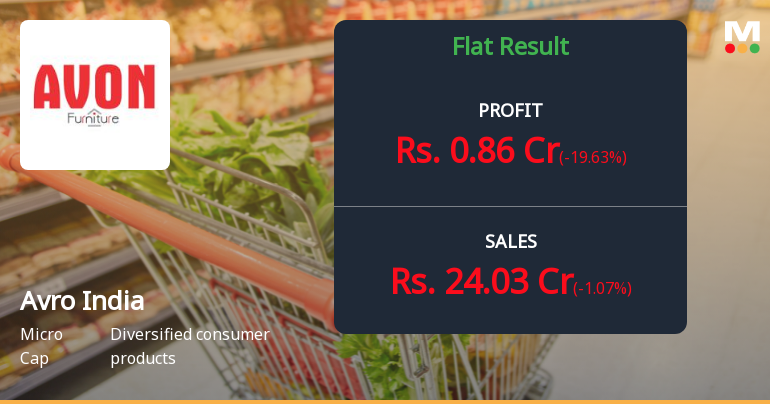
Avro India Q4 FY26: Profit Plunges 28% Despite Revenue Growth – Margin Erosion Raises Red Flags
Avro India Ltd., a micro-cap diversified consumer products company with a market capitalisation of ₹142.00 crores, reported a concerning set of results for Q4 FY26, with net profit declining 27.94% quarter-on-quarter to ₹0.98 crores despite revenue growth of 9.03%. The stock has reacted negatively to the earnings announcement, trading at ₹10.49 on June 1, 2026, down 6.34% from its previous close and now hovering just 5.43% above its 52-week low of ₹9.95.
Read full news article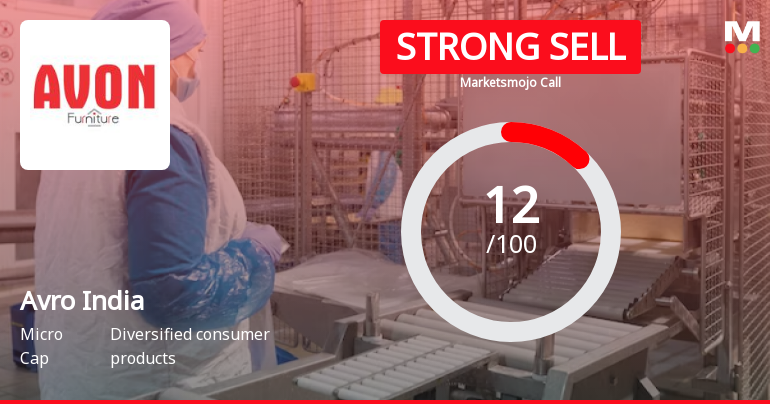
Avro India Ltd is Rated Strong Sell
Avro India Ltd is rated Strong Sell by MarketsMOJO. This rating was last updated on 17 Nov 2025, reflecting a shift from the previous 'Sell' grade. However, all fundamentals, returns, and financial metrics discussed below are current as of 01 June 2026, providing an up-to-date view of the stock's position in the market.
Read full news article Announcements
Announcement under Regulation 30 (LODR)-Newspaper Publication
08-Jun-2026 | Source : BSEAs per Reg. 47(3) of SEBI (Listing Obligations and Disclosure Requirements) Regulations 2015 the Company has published the intimation prior to dispatch of notice of ensuing Extraordinary General Meeting in all editions of Financial Express (English) and in Jansatta (Hindi). Further in pursuance of Reg. 30 read with Para A of Part A of Schedule III of SEBI (Listing Obligations and Disclosure Requirements) Regulations 2015 we submiot herewith copy of newspaper for the shareholders of the Company that the Extraordinary General meeting of the members of the Company is scheduled to be held on Tuesday June 30 2026 at 01:00 pm through Video Conferencing/Other Audio visual means
Extraordinary General Meeting On June 30 2026
08-Jun-2026 | Source : BSEPursuant to Reg. 30 read with Para A of Part A of Schedule III of SEBI (Listing Obligations and Disclosure Requirements) Regulations 2015 we hereby inform you that Extraordinary General meeting of the Company will be held on Tuesday June 30 2026 at 01:00 pm through Video Conferencing/Other Audio-Visual means. The remote evoting shall commence on Saturday June 27 2026 at 09:00 am and ends on Monday June 29 2026 at 05:00 pm. The cut-off date for determining eligibility of shareholders to exercise remote evoting rights and attendance at EGM is Tuesday June 23 2026.
Board Meeting Outcome for Disclosure Under Reg. 30 Of SEBI (Listing Obligations And Disclosure Requirements) Regulations 2015
06-Jun-2026 | Source : BSEPursuant to Regulation 30 read with Schedule III of SEBI (Listing Obligations and Disclosure Requirements) Regulations 2015 we wish to inform you that the Board in its meeting held today i.e. June 06 2026 has approved the sale of some plant & machineries at fair value on June 30 2026 to its Wholly owned subsidiary i.e. Avro Recycling Limited subject to approval ofshareholders.
Corporate Actions

No Upcoming Board Meetings

No Dividend history available

Avro India Ltd has announced 1:10 stock split, ex-date: 05 May 26

Avro India Ltd has announced 21:10 bonus issue, ex-date: 27 Jan 22

No Rights history available
Quality key factors
Valuation key factors
Technicals key factors
 Technical Indicator Scale: Bearish, Mildly Bearish, Sideways, Mildly Bullish, Bullish Turned
 Shareholding Snapshot : Apr 2026
Shareholding Compare (%holding)
Promoters
None
Held by 0 Schemes
Held by 3 FIIs (6.85%)
Sushil Kumar Aggarwal (19.08%)
Nav Capital Vcc - Nav Capital Emerging Star Fund (6.32%)
34.55%
Quarterly Results Snapshot (Standalone) - Mar'26 - QoQ

QoQ Growth in quarter ended Mar 2026 is -1.07% vs 15.67% in Dec 2025
QoQ Growth in quarter ended Mar 2026 is -19.63% vs -12.30% in Dec 2025
Half Yearly Results Snapshot (Standalone) - Sep'25

Growth in half year ended Sep 2025 is 22.72% vs -16.58% in Sep 2024
Growth in half year ended Sep 2025 is 53.02% vs -26.96% in Sep 2024
Nine Monthly Results Snapshot (Standalone) - Dec'25
YoY Growth in nine months ended Dec 2025 is 13.82% vs -16.98% in Dec 2024
YoY Growth in nine months ended Dec 2025 is 32.41% vs -19.94% in Dec 2024
Annual Results Snapshot (Standalone) - Mar'26
YoY Growth in year ended Mar 2026 is 16.18% vs -16.12% in Mar 2025
YoY Growth in year ended Mar 2026 is 38.49% vs -24.75% in Mar 2025
About Avro India Ltd

Company Coordinates


