
Compare AWFIS Space with Similar Stocks
Dashboard
Poor Management Efficiency with a low ROCE of 6.85%
- The company has been able to generate a Return on Capital Employed (avg) of 6.85% signifying low profitability per unit of total capital (equity and debt)
High Debt Company with a Debt to Equity ratio (avg) of 2.78 times
Healthy long term growth as Net Sales has grown by an annual rate of 32.65% and Operating profit at 83.23%
With a growth in Net Sales of 7.43%, the company declared Very Positive results in Mar 26
With ROCE of 8.4, it has a Attractive valuation with a 1.8 Enterprise value to Capital Employed
Stock DNA
Diversified Commercial Services
INR 2,226 Cr (Small Cap)
31.00
32
0.00%
2.56
12.83%
3.98
Total Returns (Price + Dividend) 
AWFIS Space for the last several years.
Risk Adjusted Returns v/s
Returns Beta

News

AWFIS Space Solutions Ltd Valuation Shifts Signal Renewed Price Attractiveness
AWFIS Space Solutions Ltd has seen a notable shift in its valuation parameters, moving from a fair to an attractive rating despite ongoing market headwinds and a challenging price performance relative to the Sensex. This change reflects evolving investor sentiment and improved relative metrics compared to its diversified commercial services peers.
Read full news article
AWFIS Space Solutions Ltd is Rated Hold
AWFIS Space Solutions Ltd is rated 'Hold' by MarketsMOJO, with this rating last updated on 25 May 2026. However, the analysis and financial metrics discussed here reflect the stock's current position as of 17 June 2026, providing investors with an up-to-date view of the company’s fundamentals, returns, and overall outlook.
Read full news article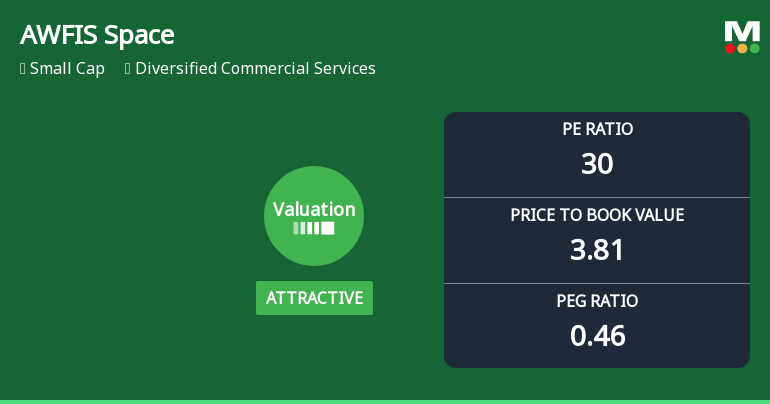
AWFIS Space Solutions Ltd: Valuation Shifts Signal Renewed Price Attractiveness Amid Market Challenges
AWFIS Space Solutions Ltd has witnessed a notable shift in its valuation parameters, moving from a fair to an attractive rating despite ongoing market headwinds and a challenging price performance relative to benchmarks. This change reflects evolving investor sentiment and improved relative value metrics compared to peers in the diversified commercial services sector.
Read full news article Announcements
Corporate Actions

No Upcoming Board Meetings

No Dividend history available

No Splits history available

No Bonus history available

No Rights history available
Quality key factors
Valuation key factors
Technicals key factors
 Technical Indicator Scale: Bearish, Mildly Bearish, Sideways, Mildly Bullish, Bullish Turned
 Shareholding Snapshot : Mar 2026
Shareholding Compare (%holding)
Mutual Funds
None
Held by 16 Schemes (35.49%)
Held by 45 FIIs (26.36%)
Amit Ramani (16.8%)
Hdfc Small Cap Fund (9.79%)
11.85%
Quarterly Results Snapshot (Consolidated) - Mar'26 - QoQ

QoQ Growth in quarter ended Mar 2026 is 7.43% vs 4.07% in Dec 2025

QoQ Growth in quarter ended Mar 2026 is 7.34% vs 35.63% in Dec 2025
Half Yearly Results Snapshot (Consolidated) - Sep'25
Growth in half year ended Sep 2025 is 27.53% vs 38.97% in Sep 2024
Growth in half year ended Sep 2025 is -37.41% vs 427.75% in Sep 2024
Nine Monthly Results Snapshot (Consolidated) - Dec'25
YoY Growth in nine months ended Dec 2025 is 24.83% vs 40.77% in Dec 2024
YoY Growth in nine months ended Dec 2025 is -15.94% vs 399.05% in Dec 2024
Annual Results Snapshot (Consolidated) - Mar'26
YoY Growth in year ended Mar 2026 is 23.68% vs 42.26% in Mar 2025
YoY Growth in year ended Mar 2026 is 4.39% vs 486.28% in Mar 2025
About AWFIS Space Solutions Ltd

Company Coordinates


