
Compare Axtel Industries with Similar Stocks
Dashboard
The company is Net-Debt Free
Poor long term growth as Net Sales has grown by an annual rate of 7.84% and Operating profit at 6.20% over the last 5 years
With a growth in Operating Profit of 174.7%, the company declared Outstanding results in Mar 26
With ROE of 25, it has a Expensive valuation with a 5.8 Price to Book Value
Despite the size of the company, domestic mutual funds hold only 0% of the company
Stock DNA
Industrial Manufacturing
INR 712 Cr (Micro Cap)
23.00
34
4.05%
-0.78
25.00%
5.77
Total Returns (Price + Dividend) 
Latest dividend: 12 per share ex-dividend date: Mar-09-2026
Risk Adjusted Returns v/s
Returns Beta

News
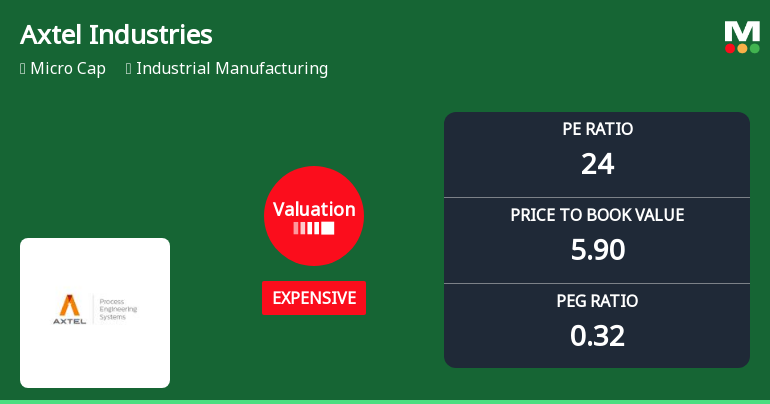
Axtel Industries Ltd Valuation Shift Signals Price Attractiveness Change
Axtel Industries Ltd has witnessed a notable change in its valuation parameters, moving from a fair to an expensive rating, reflecting a shift in price attractiveness amid evolving market dynamics. This article analyses the recent valuation metrics, compares them with peer averages and historical benchmarks, and assesses the implications for investors.
Read full news article
Axtel Industries Ltd is Rated Hold
Axtel Industries Ltd is rated 'Hold' by MarketsMOJO, with this rating last updated on 06 May 2026. However, the analysis and financial metrics discussed here reflect the stock's current position as of 09 June 2026, providing investors with an up-to-date view of the company’s fundamentals, returns, and market standing.
Read full news article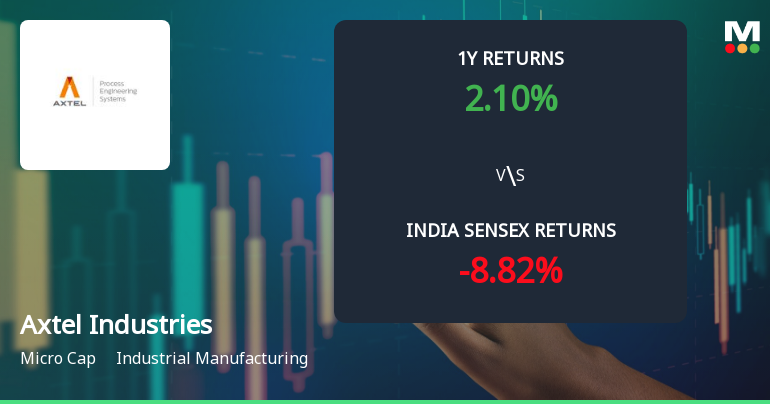
Axtel Industries Ltd Technical Momentum Shifts Amid Mixed Indicator Signals
Axtel Industries Ltd, a micro-cap player in the industrial manufacturing sector, has experienced a notable shift in its technical momentum, moving from a sideways trend to a mildly bearish stance. Despite this, the stock’s longer-term indicators present a complex picture, with bullish signals on weekly charts contrasting bearish monthly trends. This nuanced technical landscape, combined with recent price action and relative performance against the Sensex, offers investors a detailed framework to assess the stock’s near-term prospects.
Read full news article Announcements
Financial Results For The Quarter/ Year Ending On 31St March 2026
07-May-2026 | Source : BSEWe hereby submit financial results for the quarter/ year ending on 31st March 2026 along with Auditors Report and declaration signed by Whole-time Director for unmodified opinion.
Board Meeting Outcome for Audited Financial Results For The Quarter/Year Ended On 31.03.2026
07-May-2026 | Source : BSEWe herewith submit financial results along with auditors report and declaration signed by Whole-time Director for unmodified opinion for the financial year 2025-26.
Corporate Action-Board approves Dividend
07-May-2026 | Source : BSERecommendation of Interim dividend declared on 2nd March 2026 at Rs. 12.00 per equity share as Final dividend for the financial year 2025-26.
Corporate Actions

No Upcoming Board Meetings

Axtel Industries Ltd has declared 120% dividend, ex-date: 09 Mar 26

No Splits history available

No Bonus history available

No Rights history available
Quality key factors
Valuation key factors
Technicals key factors
 Technical Indicator Scale: Bearish, Mildly Bearish, Sideways, Mildly Bullish, Bullish Turned
 Shareholding Snapshot : Mar 2026
Shareholding Compare (%holding)
Promoters
None
Held by 0 Schemes
Held by 2 FIIs (0.41%)
Shivash Business Advisory Llp (19.19%)
Meena Pathak (6.78%)
30.49%
Quarterly Results Snapshot (Standalone) - Mar'26 - YoY

YoY Growth in quarter ended Mar 2026 is 87.64% vs -27.89% in Mar 2025
YoY Growth in quarter ended Mar 2026 is 134.45% vs -10.36% in Mar 2025
Half Yearly Results Snapshot (Standalone) - Sep'25
Growth in half year ended Sep 2025 is -5.95% vs -14.35% in Sep 2024
Growth in half year ended Sep 2025 is 20.08% vs -41.94% in Sep 2024
Nine Monthly Results Snapshot (Standalone) - Dec'25
YoY Growth in nine months ended Dec 2025 is 8.68% vs -17.65% in Dec 2024
YoY Growth in nine months ended Dec 2025 is 50.72% vs -50.52% in Dec 2024
Annual Results Snapshot (Standalone) - Mar'26
YoY Growth in year ended Mar 2026 is 25.32% vs -20.05% in Mar 2025
YoY Growth in year ended Mar 2026 is 72.82% vs -43.88% in Mar 2025
About Axtel Industries Ltd

Company Coordinates


